2 Bridging Material Culture Networks and Social Networks in Archaeology
2.1 Introduction
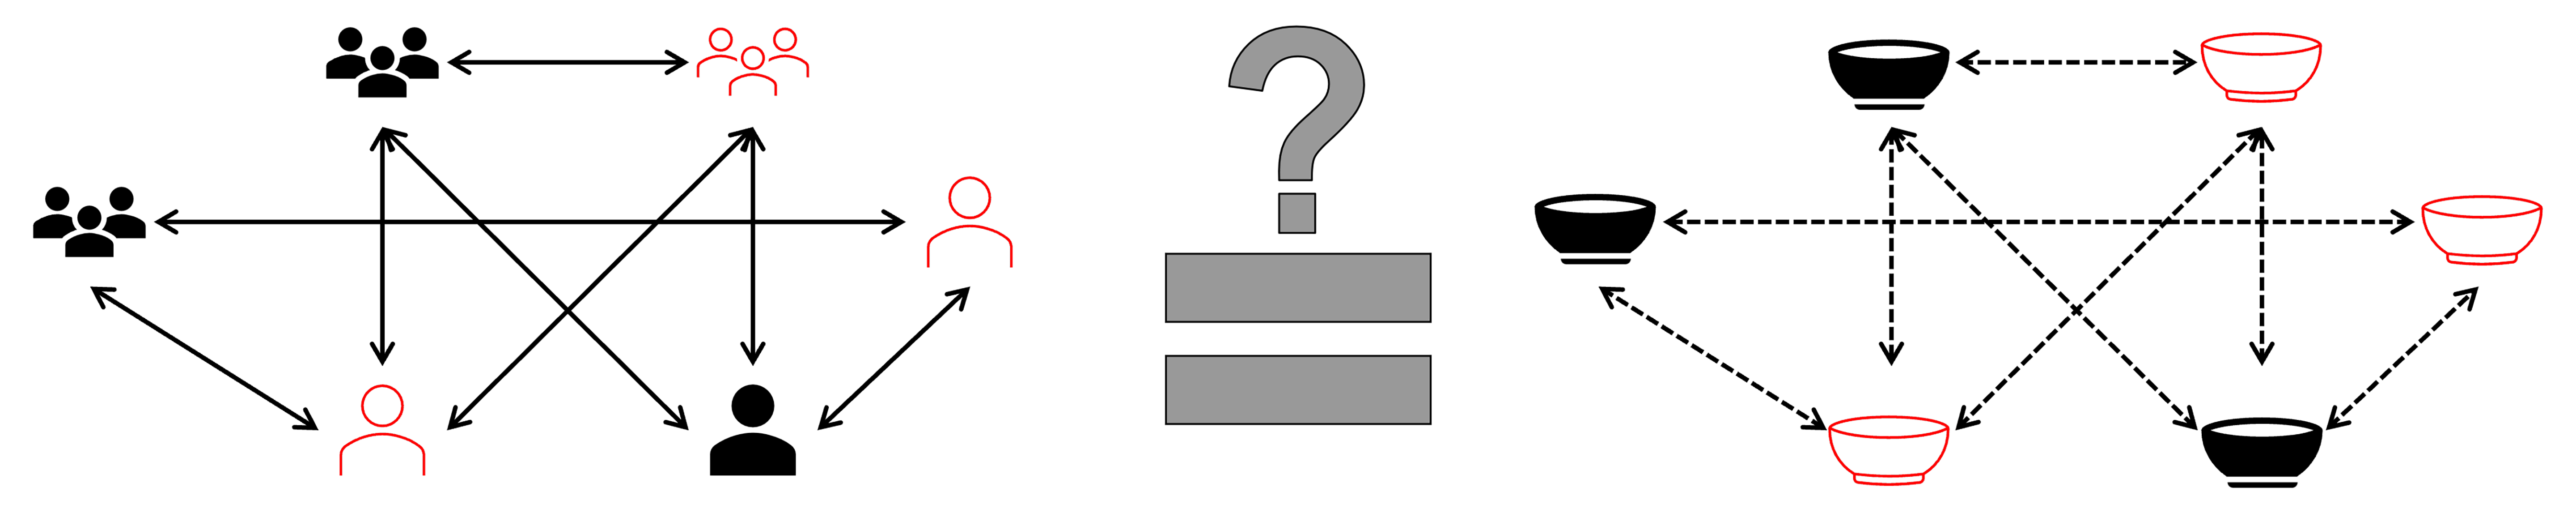
Over the last two decades, network studies have proliferated in archaeology and the social and behavioral sciences in general. In archaeology, much of this work has focused on building empirical networks based on artifact distributions and frequencies. The underlying assumption governing much of that work is that similarities or the presence of common categories or types of materials can be used as a proxy for connections among people at various scales (see Peeples 2019). The complexities of the relationships between material similarity and relationships among people is sometimes acknowledged (Peeples et al. 2016, 2024; Sindbæk 2007), but there has been relatively little work focused explicitly on testing the underlying assumptions of such network models (but see Golitko 2023; Gravel-Miguel and Coward 2024). This leaves us with an essential question: to what degree can similarities in attributes or types of artifacts serve to represent patterns of interaction that occurred in the past and how do such patterns relate to our formal network models (Figure 2.1)? In this paper, we attempt to approach this complex relationship using a combination of Agent Based Models and statistical approaches for evaluating network processes.
Discussions about material culture in archaeology, particularly its use as a proxy for social interaction, are extensive (Gosselain 2000; Hegmon 1992; Hodder 1982; Peeples 2018; Wiessner 1983). Although the arguments about the connections between material patterns and social processes are diverse, there are a few commonalities that have been recognized across a broad array of contexts. For example, highly visible aspects of style (e.g., painted designs, public buildings, ceramic decoration, textile patterns, personal adornments) are widely seen and displayed thus material similarities may indicate some degree of interaction between producers or simply imitation without direct contact. On the other hand, similarities in low-visibility technological aspects of design and production (e.g., hidden foundation stones) tend to more often result from direct, frequent interactions, such as those found in shared learning environments. This essentially mirrors older debates in archaeology and the anthropology of technology focused on style vs. isochrestic variation and the relation with other social processes (J. R. Sackett 1982; James R. Sackett 1986; Wiessner 1985; see Hegmon 1992). Numerous studies have examined the connection between material culture and social identity (Carr 1995a, 1995b; Clark 2001; Dietler and Herbich 1998; Gosselain 2000; Hodder 1982; Huntley 2008; Lemonnier 1986; Lyons 2003; Neuzil 2008; Wiessner 1983), revealing that variation in technological practices—whether in building, pottery, or weapons—can sometimes reflect social identity, though this is not always the case. Determining the significance of such variation requires empirical analysis on a case-by-case basis. We must add that we define social identity in a broad sense recognizing that it is mutable and multiple for each person.
There are some recurring patterns in the literature on material culture and identity, such as the role visibility plays in linking material style to social behavior (Carr 1995b, p. 173; Wobst 1977). Visibility influences transmission levels: low-visibility traits are harder to observe and replicate, typically requiring more skill and closer involvement, while high-visibility traits are often more easily copied. For instance, the spread of low-visibility technologies is often interpreted as evidence of migration, while the spread of highly visible styles is more likely to signify emulation or diffusion (Clark 2001). This is because high-visibility traits are more likely to be copied than low-visibility traits. Communities of practice tend to exhibit commonalities in low-visibility attributes, reflecting the strong relational connections within them. By contrast, constellations of practice (groups of related communities) show greater diversity yet still share relational connections through history, kinship, geography, or other ties (Van Oyen 2016; Wenger 1998, pp. 126–133). Sharing high-visibility attributes suggests a social connection but doesn’t necessitate frequent interaction.
Studies of cultural transmission suggest there are two primary mechanisms which high or low-visibility traits may be learned: prestige and conformism. Prestige-based transmission occurs when individuals preferentially imitate those who are perceived as successful or esteemed within their group, thereby acquiring skills or knowledge that are associated with high status. These traits are, presumably, more advantageous (Henrich 2004; Morgan et al. 2015). In contrast, conformist transmission refers to the tendency of individuals to adopt the most common behaviors or beliefs within their social group, effectively leading to homogenization of cultural traits. This mechanism can enhance group cohesion and facilitate the maintenance of cultural boundaries, as it tends to reduce variation within groups while increasing differences between them (Henrich 2004; Muthukrishna et al. 2016). However, while conformist transmission can stabilize cultural norms, it may also impede the spread of innovative ideas, particularly in dynamic environments where adaptability is crucial (Morgan et al. 2015). Both types of transmission occur in any given society, although conformism is primarily relied on (Henrich and McElreath 2003, p. 131).
As the literature suggests, the relationship between material culture and social interaction is complex. It becomes clear that there is no universal answer to how effectively any form of material culture can act as a proxy for social interaction. Instead, we must approach the question from a broader perspective while accounting for historical contingencies that shape interpretations of specific types of material culture at different times.
Leaving aside the question of how specific types of material culture relate to social identity or relationships, how can the relationship between social interaction networks and material culture be evaluated if archaeologists cannot observe the past? How can we validate our methods and assumptions? Moreover, how do various social processes like exchange, migration, intermarriage, and cultural diffusion affect these patterns (see Padilla-Iglesias and Bischoff 2024 for additional discussion on this question)? One avenue to answer these questions would be to look at ethnoarchaeological studies of material culture, and indeed general models of the relationship between material culture patterns and identity are often deeply informed by ethnoarchaeological case studies (Clark 2001). In our examination of potential ethnoarchaeological studies, however, we found four major limitations: the availability of data, the scale of the study, the time depth of the study, and the lack of sufficient variables. A major exception to these limitations is the study by Golitko (2023) using ethnographic data from across New Guinea. He compared material culture networks, created from bone dagger attributes and ethnographic records of interaction, and found some evidence that material culture networks are correlated with social networks, but the correlations were not strong. Centrality scores and neighborhood detection also performed poorly. Golitko suggests caution when applying network methods to archaeological data, although he recognizes limitations in his study and continues to support the use of network analysis as a tool for archaeologists. This study is an excellent example of how ethnographic data can be used to address the relationship between material culture and social networks. In general, ethnoarchaeological studies are often limited to a single village or a small number of villages. Data collection is time consuming and difficult even at smaller scales. The time depth of these studies is usually limited. Most studies are conducted over a few years, although some have been conducted over decades. However, the time depth of these studies is still orders of magnitude less than the time depth of archaeological studies. Finally, ethnoarchaeological studies often lack the variables needed to answer the questions we are interested in. For example, many studies do not record the social networks related to the material culture they are studying or vice versa.
What is needed is a dataset of material culture that spans several generations, encompasses a large region with sufficient material culture variability to recognize cultural boundaries, and results from the direct social interaction between individuals. If we cannot observe the past or the present to obtain the necessary data, then we are left with the virtual. This is precisely what agent-based models (ABMs) provide. ABMs have been likened to “behavioral laboratories” (Premo 2006) where experiments can be conducted under controlled conditions. ABMs are computer simulations where agents make decisions based on a set of rules. Over time these simple rules can lead to complex, emergent behaviors (Epstein 2006). We are not the first to investigate the relationship between material culture and social networks using an ABM. Work by Gravel-Miguel (2017; Gravel-Miguel and Coward 2024), a co-author of the agent-based model discussed herein, found that similarities in artifact attributes can serve as adequate representations of past social interactions, particularly when cultural transmission is a key factor. She found that material culture, influenced by mechanisms like conformism and prestige-based learning, correlates with social networks, though indirect transmission and environmental constraints may complicate the accuracy of these reconstructions, and careful consideration of external factors is necessary for accurate interpretation.
The model used in this analysis, ArchMatNet (Bischoff et al. 2024; Bischoff and Padilla-Iglesias 2023; Padilla-Iglesias and Bischoff 2024), is designed to replicate simple social interactions among hunter-gatherers. The model details are presented in a future section. Elsewhere we use the ArchMatNet model to shed light on how variability in the settlement patterns and mobility strategies among prehistoric societies affected the structure of the archaeological record and our ability to recover past social networks from it (Padilla-Iglesias and Bischoff 2024). Here, we investigate more broadly how social interaction networks correlate with material culture networks, investigate the correlations between specific activities and material culture, compare the generative properties of each type of network, and investigate the contributions of various parameters from the model.
2.1.1 Networks in Archaeology
Network science approaches to archaeological research continue to grow (Brughmans and Peeples 2017; Collar et al. 2015) for good reasons. Network methods have already proved useful as tools for exploring and formalizing complex relational patterns in archaeological data across a huge array of contexts, scales, and questions (see Peeples 2019; Brughmans, Mills, Munson and Peeples 2024). Beyond this, network theory and network thinking also have the potential to help us move beyond some of the “culture-historical baggage” (Holland-Lulewicz 2021, p. 538), and rigidly defined categories of traditional archaeological models towards an approach that better accommodates the empirical ethnographic and archaeological evidence of variability and fluid boundaries (Feinman and Neitzel 2020; Holland-Lulewicz 2021; John Edward Terrell et al. 2023). In their critiques of the tacit continuation of culture-history methods in archaeology, Feinman and Neitzel (2020) and Holland-Lulewicz (2021) suggest relational perspectives, such as social network analysis, are key to moving beyond the rigid categorical approaches currently fundamental to archaeological practice.
The relational perspective fundamental to network approaches holds that we must consider both the nature and structure of interactions among social units as well as the attributes of individuals or groups to fully understand social phenomena (Brughmans and Peeples 2023, p. 19; Peeples 2019, p. 6). Network science is concerned with all aspects of relational data (Brandes et al. 2013, p. 19), and networks can be generated from many types of archaeological data. Common network types include material culture (Mills et al. 2013), movement (Scheidel 2014), spatial proximity (John E. Terrell 1977), and inter-visibility (Fraser 1980). In each of these examples, a person, group, or place is represented by a node and a relationship is created to other nodes. It is the relationship between these nodes that defines the structure of the network. Relationships are defined in many ways, but here we are interested in similarity networks in which the relationships represent commonalities in the relative frequencies material culture attributes. Similarities in material culture are seen as a proxy for the probability of a connection between a set of actors or contexts and can be treated a weighted based on the strength of such similarities (Peeples and Roberts 2013). Each network can be analyzed visually in a network graph or quantified using various formal metrics, such as centrality scores. Network centrality measures the potential influence of a node on the network and different centrality metrics can be used to characterized different kinds of flows and movements across networks (Borgatti 2005). Nodes that have a high centrality score for a given metric may have more connections than average or may be positioned centrally in the network and thus may gain some advantage based on their position.
Despite the promise of network methods for addressing a broad range of archaeological questions pertaining to interaction, there are many challenges. Even the creation of a network representation can be difficult. In archaeological practice, a network is an abstraction of the phenomena we wish to study (Collar et al. 2015). Prignano and colleagues (2017) list three common difficulties in creating network representations: defining boundaries, nodes, and relations. None of these are easy tasks and all existing caveats to archaeological data are applicable to network datasets: missing or incomplete data, inaccurate data, taphonomic issues, taxonomic issues and others. Some work has been done on the issues mentioned by Prignano and colleagues. Re-sampling networks has shown that many large networks are robust to missing nodes (Gjesfjeld 2015; Peeples et al. 2016), as long as the samples are random (Bischoff et al. 2024). Even once a network representation has been created, there are many issues regarding its interpretation. Here we are concerned particularly with archaeological similarity networks. These networks are typically created with a site or context as a node and relations are defined based on a similarity measure based on the relative frequencies of different categories of material culture. Rather than interpreting a relation between nodes as the existence of a face-to-face interaction, such as exchange or migration, this tie should be considered a representation of the probability of a connection having existed between the sites (Peeples 2019, p. 20). As this literature demonstrates, network analysis in archaeology has not been adopted uncritically, yet there remains more to be done. If similarity networks represent only the probability of interaction, as Peeples indicates, then this leaves an important question: how well does a similarity tie that represents the probability of interaction compare to the actual interaction that took place in the past?
As mentioned, Golitko (2023) addressed this question with an ethnoarchaeological study, but he recognizes that the study has limitations. For example, the ethnographic network is composed of binary ties indicating whether a relationship existed between communities. How might the results change if the network were weighted by the frequency of interaction? Eigenvector centrality, one of the centrality measures used by Golitko, is commonly used by archaeologists and is a good way to measure the importance of a node in a network. Calculating the eigenvector centrality for the entire ethnographic network shows that all of the sites that contain bone dagger data had a centrality score of zero. How might the results be different if more central locations in the network had bone dagger data? These questions are not meant to disparage the work of Golitko, but to highlight the complexity of working with network data or any archaeological or ethnographic data. This complexity is why we turned to agent-based models to compliment the work of Golitko and others.
2.1.2 Agent Based Models
An agent-based model (ABM) is a computer simulation in which agents are programmed to make decisions based on a set of rules (see Romanowska et al. 2021 for an overview). Over time these rules can lead to complex, emergent behaviors (Epstein 2006). Characteristics of emergent behaviors include self-organization, unpredictability, and bottom-up processes. In other words, the end result of the simulation is not preprogrammed into the model but develops as the model progresses from the base set of rules. ABMs can be useful in a variety of circumstances in archaeology, although they are “not a miracle cure” or “panacea” as Rogers and Cegielski write (2017, p. 12843). These authors note there are several areas ABMs are particularly useful. One of the ways they suggest ABMs can be useful is exploring material links to social dynamics (Rogers and Cegielski 2017, p. 12843). That is precisely what we attempt here. While ABMs clearly cannot replicate reality or replace empirical data, they are particularly valuable in that they force researchers to explicitly state our assumptions. It is easy to overlook assumptions when crafting a narrative from archaeological data, but in an ABM, every assumption must be programmed into the model. ABMs can be more generalized (Barton and Riel-Salvatore 2014; Brantingham 2003; Creanza et al. 2017; White 2013) or more specific and based on empirical data (Barton et al. 2011; Brughmans and Poblome 2016; Crabtree 2015; Gravel-Miguel 2017). In our case, we use a more generalized model. By eliminating data specific to any one place or time, we hope to more clearly see the relationships between material culture and social interaction networks without introducing confounding variables.
2.2 ArchMatNet
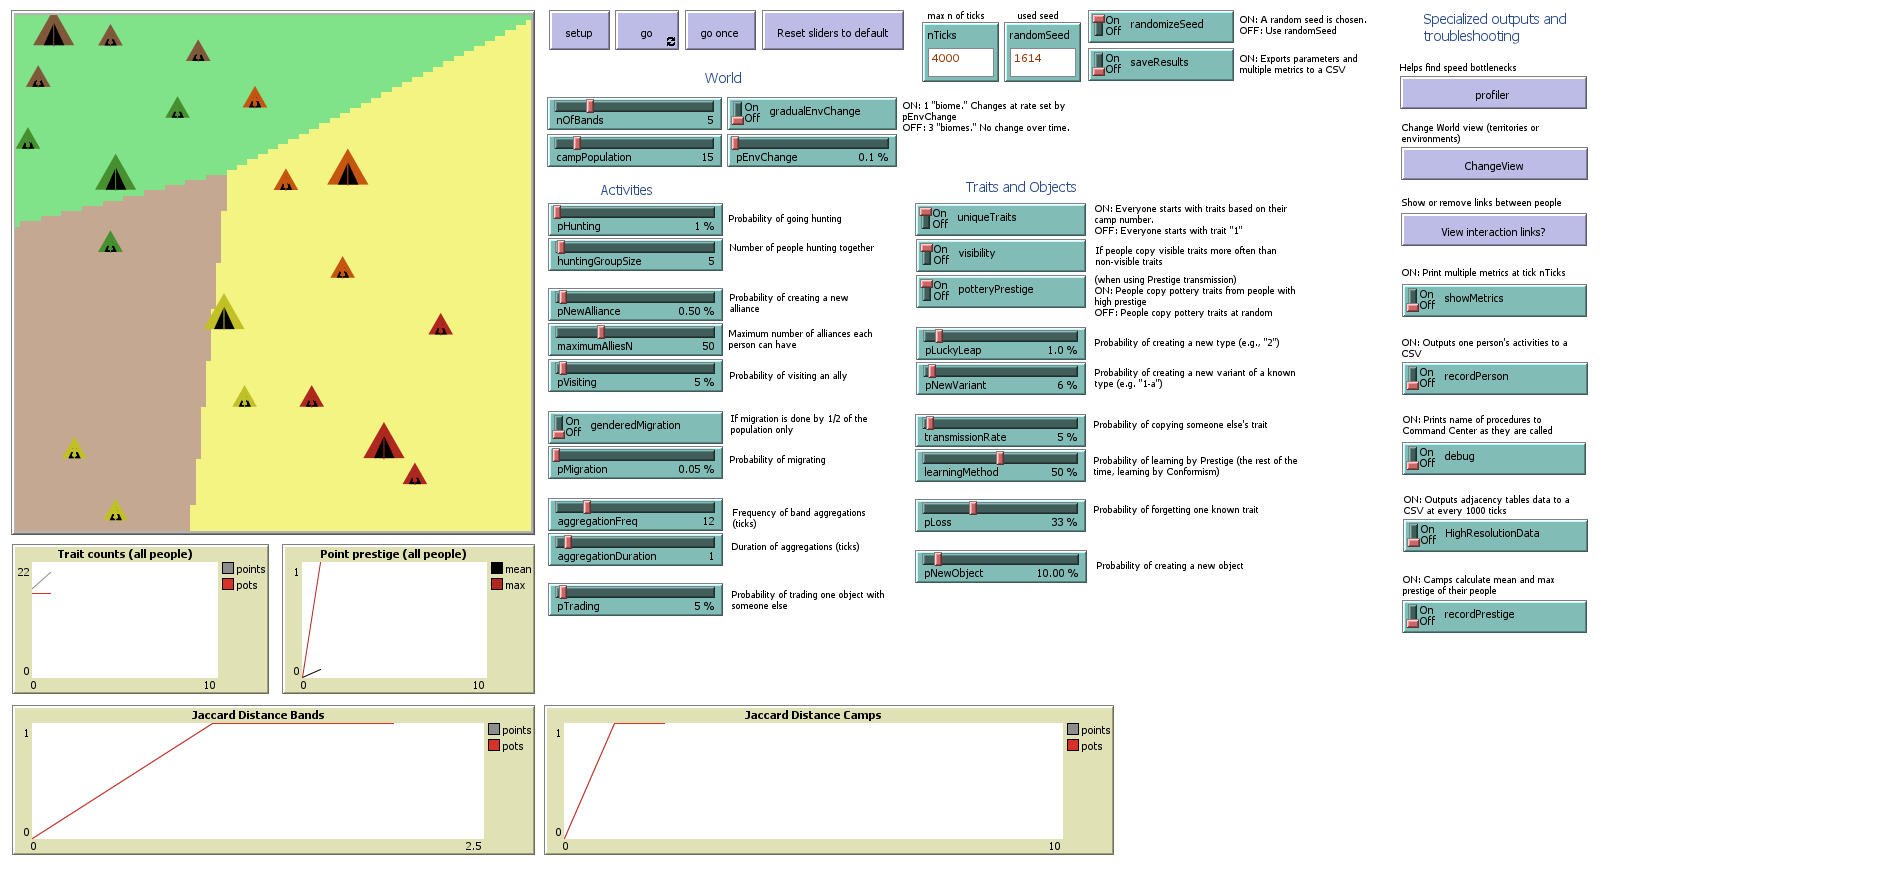
The ArchMatNet model is a generalized agent-based model (ABM) designed to represent patterns of social interaction and material culture among hunter-gatherers or small-scale horticulturalists (Figure 2.2). Agents represent individuals who are organized into hierarchically nested social groups: each agent belongs to a camp, and each band consists of three camps. Bands are spatially dispersed across a virtual landscape, and the simulation proceeds in discrete time steps representing monthly intervals.
A key feature of the model is that opportunities for interaction are hierarchically structured:
Most interactions occur among agents in the same camp
Fewer interactions occur among agents in different camps within the same band
The fewest interactions occur among agents in different bands
This pattern mimics expected real-world social behavior, where interaction is more frequent and intense within smaller social units and decreases with social distance. While this is the general pattern set out in the model, each run will differ in actual execution due to the stochasticity built into the model.
During each monthly time step, agents may engage in several activities:
Produce pottery or projectile points using known styles
Innovate new pot or point styles
Visit or hunt with other agents (hunting is band-limited; visiting spans bands)
Participate in band aggregation events where all band members temporarily co-reside
Migrate to a different camp
Every interaction provides a chance for material exchange (trading pots/points) and social learning (adopting new styles). Learning occurs either through conformism (copying popular styles) or prestige bias (copying successful or admired individuals). Parameters defined by the user govern the frequency of each activity and the likelihood of trade, learning, and innovation (see Table 2.1).
Pots and points are randomly dropped by agents and form the virtual archaeological record. All agent interactions are recorded, producing a dataset of social ties. Thus, the model outputs both material culture and social network data, allowing us to evaluate how well material culture proxies capture patterns of interaction.
The model assumes a one-month timestep to balance temporal resolution and computational efficiency. A typical run includes 4,000 time steps, equivalent to ~333 years, which is appropriate for simulating archaeological time scales. Although camps are dispersed, the model assumes that agents can visit any other camp and return within a month–consistent with estimated round-trip travel distances of ~540 km based on known daily mobility rates (Drennan 1984).
Each agent has a personal network of friends or allies whom they may visit. These relationships are dynamic and may include individuals from other camps or bands. However, intra-band connections dominate, reinforcing stronger cohesion at the band level, which is in line with ethnographic expectations. Because each step represents a full month, agents may participate in multiple activities per time step.
| Parameter | Default Value | Description |
|---|---|---|
| aggregationDuration | 1 | Length of aggregation (one time step) |
| aggregationFreq | 12 | Frequency of aggregation (camps gathering together by band every n time steps) |
| campPopulation | 15 | Number of agents in each camp |
| pTrading | 5 | Probability (out of 100) that trading will occur |
| pHunting | 1 | Probability (out of 100) that hunting will occur |
| learningMethod | 50 | Probability of prestige learning versus conformism (0 means that all people learn from conformism while 50 is an equal mix of prestige and comformism and 100 is complete prestige learning) |
| nOfBands | 3 | Number of bands (three camps are created per band) |
| nTicks | 4000 | The number of ticks (time steps) the simulation lasts |
| pMigration | 0.05 | Probability (out of 100) that migration occurs |
| pLuckyLeap | 1 | Probability (out of 100) that a new style of artifact is invented |
| pNewObject | 10 | Probability (out of 100) that a new object is created by an agent |
| transmissionRate | 5 | Probability (out of 100) that a new object is created by an agent |
| uniqueTraits | TRUE | Determines if everyone starts with the same trait or if they start with a trait unique to their own camp |
| visibility | TRUE | Determines if some traits are more visible (and thus easier to transmit) than others |
| pVisiting | 5 | Probability (out of 100) that visting occurs |
Agents can learn through conformity by copying popular styles or through prestige by copying the style of the most successful hunter or most popular potter. One model parameter that affects the probability of traits being copied is called visibility. This parameter can be turned on or off, and, when on, randomly assigns traits as high-visibility or low-visibility. High-visibility traits have a much greater chance of being passed on than low-visibility traits.
Agents make pots and points based on styles they learn from others or innovate themselves. The model can be set to give each camp a unique starting trait for pots and points or to have a single starting trait for all agents.
The primary difference between points and pots is that prestige is assigned randomly to pots, while prestige for points is based on hunting success. Hunting success is based on the suitability of a point type to the local environment. Thus, there is a functional aspect to points not present in pots. This therefore affects prestige-based learning but not conformism.
Each interaction (visiting, trading, learning, or hunting) between agents is recorded, and pots and points are randomly dropped. The pots and points found in each camp represent the archaeological record, and the summed counts of interaction between each camp represent the social networks.
With these data, we can investigate the relationships between these processes, that is, between the social interactions and resultant material patterns. For a further description of the model and an investigation of its parameters see Bischoff and Padilla-Iglesias (2023) or see the description of the model in the supplementary material.
There is much stochasticity involved in an agent-based model (Romanowska et al. 2019). This stochasticity is represented by using assigned probabilities to determine the likelihood of an event. This randomness prevents the model from being entirely deterministic and allows even unlikely scenarios to occur. To account for the stochastic nature of the model, the results of more than 30,000 simulations were used in this analysis. Arizona State University’s Sol supercomputer (Jennewein et al. 2023) was used to run the simulations.
The total number of simulations is a result of numerous runs of the model exploring various permutations of parameters related to frequencies of activities, population sizes, learning, and other relevant parameters. As demonstrated in a prior analysis (Bischoff and Padilla-Iglesias 2023), most parameters did not significantly affect model outcomes such as similarities between camp assemblages or the number of interactions between agents in each camp (many of the 26 total parameters control the frequency of an activity or the number of agents involved in an activity), however, parameters were again tested against the graph correlations discussed in the methods section, and the results are discussed below.
Note that hunting networks are not compared due to the limitation that hunting only takes place within a band. This restricts the network to within band only making them incomparable to other networks.
As mentioned, the primary output of the ArchMatNet model is the artifact assemblage for each camp and the total interactions of each type between each camp. The model will export raw data for each camp, but we also created a condensed output for model experiments where parameters are tested through repetitive simulations of different combinations of values. This condensed output returns a matrix of values for each type of interaction showing the total counts of interactions between each camp (which are aggregated from the counts of each agent in the camp). It also returns a matrix of similarity values indicating the similarity of each artifact assemblage (pot and point) to each other camp. The methods of network construction are described in the next section.
2.3 Methods
The goal of this analysis is to compare networks generated based on the behaviors and activities directly modeled in the ABM to those generated based on the material assemblages that such behaviors left behind. This is a way for us to directly assess the degree to which material cultural patterns may or may not allow us to reconstruct the generative behaviors and also allow us to assess potential sources of equifinality. Numerous methods can be used to compare similarities in network graphs (Peeples and Brughmans 2023, sec. 12). The applicability of each method depends on the type of graphs being compared and the research questions addressed. In our case, we are comparing two types of networks. The social interaction network represents how often different camps interacted with each other, and the material culture network shows how similar the artifacts from these camps are. The social interaction network is a weighted, undirected graph where the weight of the edge represents the frequency of interaction between two camps. Undirected means that the relationships do not have a specific direction. Weighted means the edge (or relationship) between each node is represented by a value instead of a binary tie that either exists or does not exist. The material culture network is a weighted, undirected graph where the weight of the edge represents the similarity of the material culture between two camps.
The first difficulty we encountered in comparing our networks was the incommensurability of edge weights for the material culture and interaction networks. For the material culture networks, the strength of the connections between camps was determined by how similar the artifacts found in each camp at the end of the model (accumulated through random breaking of artifacts) were to one another. Each pot or point had a type assignment in the model. Similarities between pot and point assemblages were calculated using a weighted Jaccard index (see Bischoff and Padilla-Iglesias 2023 for a more detailed description). The interaction networks were created simply by aggregating the counts of each interaction of the given type (learning, trading, visiting, or hunting). Table 2.2 summarizes each network. Given that interaction intensity or similarity is the desired output, transforming the edge weights into z-scores is appropriate. Z-scores help standardize the data by showing how much each value differs from the mean, making it easier to compare different networks. Z-scores were calculated for each edge weight in the networks, which were then scaled from 0 to 1 to facilitate easier interpretation of network metrics. This method makes the edge weights more comparable and suitable for network comparison methods.
| Network | Description |
|---|---|
| Learning | Count of interactions between agents engaging in cultural transmission (either learned a trait or taught a trait) |
| Trading | Count of interactions between agents exchanging objects (pots or points) |
| Visiting | Count of interactions between agents who are allies (friends) and are visiting each at a camp or central aggregation area |
| Point | This network is created from broken (dropped) point artifacts at each camp and similarities between camps are calculated via the weighted Jaccard index |
| Pot | This network is created from broken (dropped) pot artifacts at each camp and similarities between camps are calculated via the weighted Jaccard index |
Three methods of comparing and statistically analyzing the networks are used in this study: graph correlation, the quadratic assignment procedure (QAP), and Exponential Random Graph Models (ERGMs). The graph correlation is implemented in the sna package (Butts 2023) in R (Team, R Core 2024). This correlation is equivalent to a Pearson’s product-moment coefficient and values range from 1 (perfect correlation) to -1 (perfect negative correlation) and measures the degree of agreement in the presence/absence or weights of edges in a pair of graphs representing the same set of nodes.
A QAP test (Krackardt 1987) is related to the graph correlation measure and uses Monte Carlo simulations to assess the alignment nodes and edges in a network. Essentially, the QAP method takes two similarity matrices with the same rows and columns and calculates the correlation coefficient among them and then permutes the order of the rows and columns some large number of times calculating the correlation coefficient for each permutation. QAP can then statistically assess how likely you would be to match or exceed the original correlation coefficient with a random permutation, thus helping to assess the statistical likelihood of association. This procedure is also implemented in the sna package and returns p-values indicating the likelihood that the networks are independent. In our analysis, a p-value tells us whether the networks are related or independent. A p-value of 1 means the networks are identical, while a p-value of 0 means they have no relationship.
The final method of comparison is the use of ERGMs as implemented in the ergm package (Handcock et al. 2018; Hunter et al. 2008) in R. ERGMs help us understand how different parts of a network, such as nodes and connections, form by estimating the processes that may have shaped the observed network structure. This enables us to test whether certain network features, like the connections between camps, are likely due to chance or driven by underlying interaction patterns. Although ERGMs are not commonly used in archaeology (Amati et al. 2020; Brughmans et al. 2014; Cegielski 2024; Wang and Marwick 2021), they are valuable for modeling relationships between camps in our study. By estimating parameters that describe the processes likely to have generated the network, ERGMs allow for the simulation of multiple networks, which can then be compared to the observed network to assess the likelihood that observed patterns are due to specific generative processes. These models also allow for the inclusion of various variables to predict the network structure, with different models being compared to determine the best fit.
2.4 Results
2.4.1 Network Comparisons
The first question we address is what is the overall relationship between the different networks produced from our model? These include three interaction networks (visiting, trading, and learning) as well as two types of material culture similarity networks based on pot and point types. Recall pots and points are differentiated in the model by prestige-based transmission: pot prestige is randomly assigned, while point prestige depends on hunting success. Point attributes are also adapted to specific environments, boosting hunting success. Figure 2.3 illustrates the correlations between pairs of networks (refer to Table 2.2 for network descriptions; the numerical scores are listed in Table 2.3). The visiting and trading networks are almost identical, with a correlation approaching 1.0, indicating that visiting almost always results in trade. Learning is also closely correlated with both visiting and trading, but to a lesser degree, because interaction does not always result in learning. The six correlations between types of interaction (visiting, and learning) and types of material culture (points and pots) are lower than those between two types of interaction but are still fairly strong with scores greater than 0.75; the same holds for the correlation between the two types of material culture. All of these have larger ranges because each of the material culture networks exhibit considerable outliers, as is expected with the stochasticity built into the ABM and with more than 30,000 simulations. The QAP test results listed in Table 2.3 are consistent with the graph correlation results and indicate that the strong correlations are generally not due to chance and that the networks are independent. All values are close to 1.0, indicating a strong relationship between these networks.
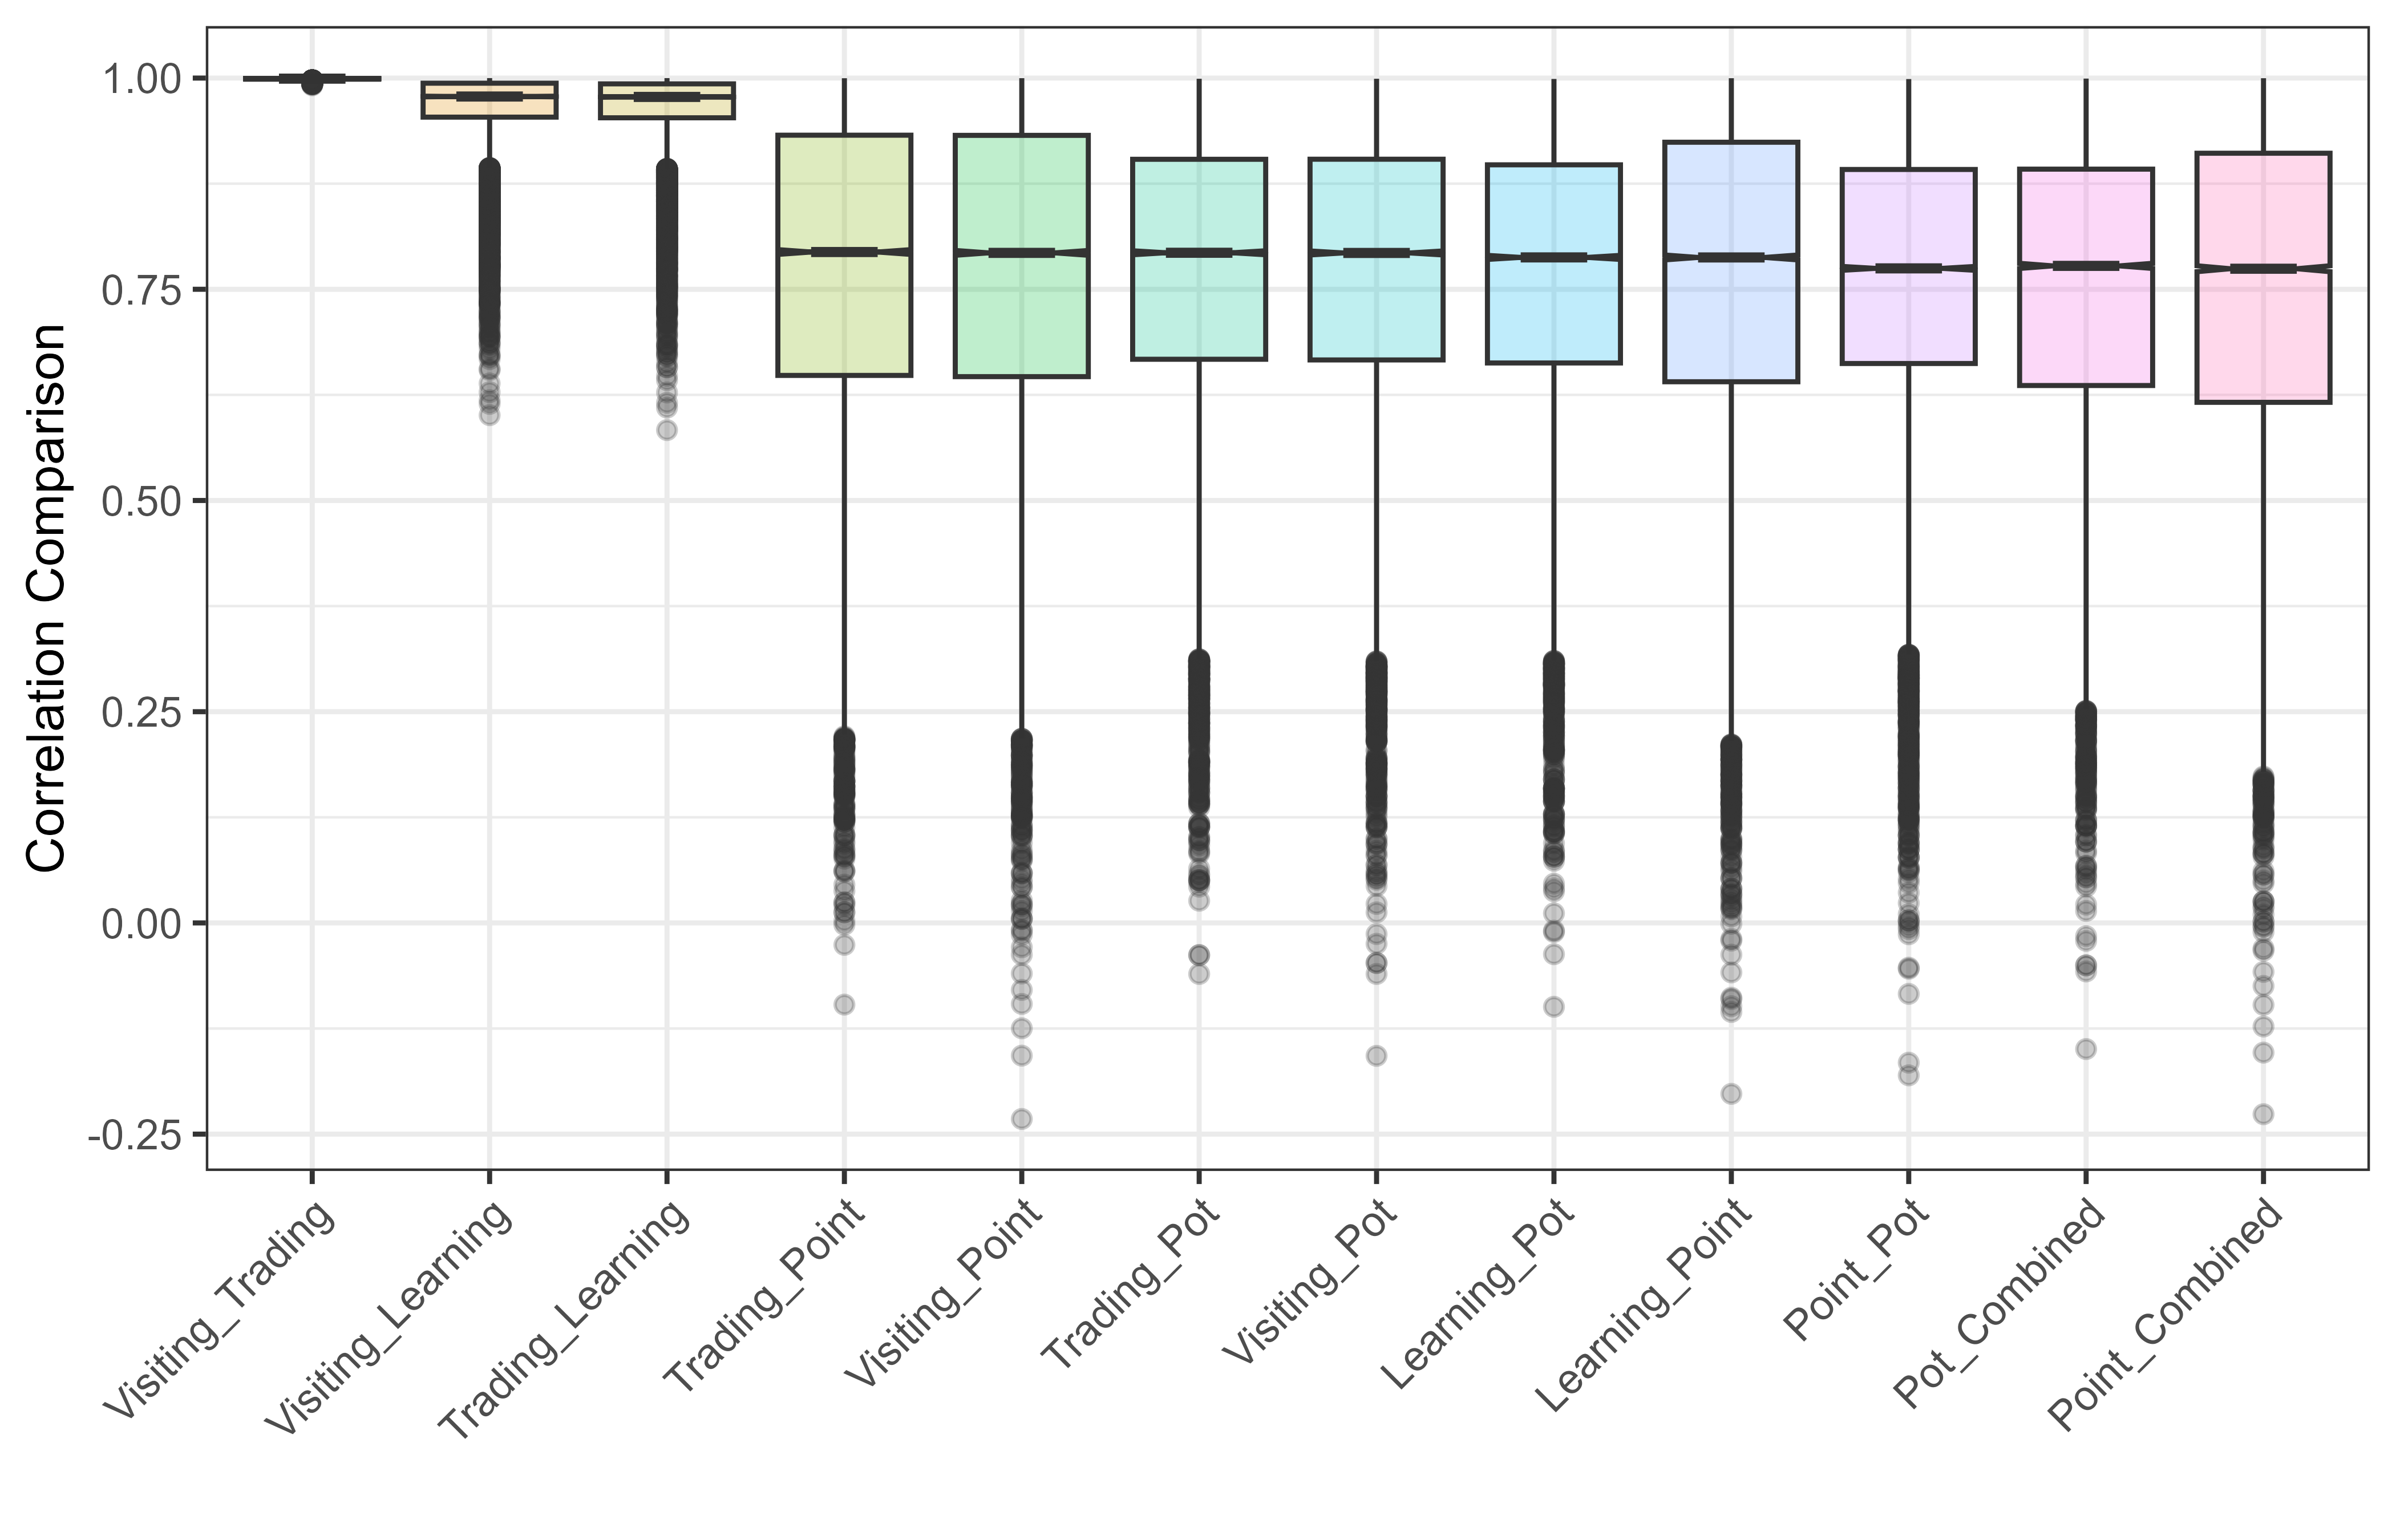
| Network Comparison | Graph Correlation | QAP Test |
|---|---|---|
| Point_Combined | 0.747 | 0.996 |
| Pot_Combined | 0.749 | 0.996 |
| Point_Pot | 0.756 | 0.997 |
| Learning_Point | 0.762 | 0.997 |
| Learning_Pot | 0.764 | 0.998 |
| Visiting_Pot | 0.767 | 0.997 |
| Trading_Pot | 0.767 | 0.998 |
| Visiting_Point | 0.769 | 0.997 |
| Trading_Point | 0.770 | 0.997 |
| Trading_Learning | 0.965 | 0.999 |
| Visiting_Learning | 0.966 | 0.999 |
| Visiting_Trading | 0.999 | 1.000 |
Outliers shown in Figure 2.3 were investigated further. Some of the outliers can be attributed to runs where the probability of trading was zero. The average correlation for visiting and point networks with a zero probability of trading was 0.12, which was much lower than any other parameter in the model. Trading being one of the three mechanisms (learning and migration are the others) for material culture to spread between camps makes it no surprise that this severely affects the material culture networks. There are, however, relatively few runs with zero probability of trading and many runs set with the default trading probability had equally low correlation values. Additionally, runs with a high probability of creating new objects also have lower correlations. Likely, this results in large numbers of objects deposited in the virtual assemblages and makes it harder to detect markers of interaction. This has relevance for interpreting large archaeological assemblages. Notably, there were no outliers for runs of the model where each parameter was set to its default value.
We expected to see some differences between how interaction networks and material culture networks correlate, but, as the boxplots in Figure 2.3 and graph correlation values in Table 2.3 show, the results indicate that the correlation values were almost the same for all types of interactions and material culture. Thus, our model does not appear to provide any insight into what types of interaction may better reflect material culture networks. This is likely due to trading and learning co-occurring with visiting. Several parameters affected the network correlations. These effects were stronger than those discovered during the initial model testing (Bischoff and Padilla-Iglesias 2023) and are discussed in the next section.
2.4.2 Model Parameters
All model parameters were tested to determine their effect on the network correlations. Parameters in an ABM are values that can be changed each simulation and affect agent behavior. The parameters discussed in this paper are listed in Table 2.1. The full parameter list can be viewed in the supplemental information online or in Appendix A Table 1 and their importance to the model are described in (Bischoff and Padilla-Iglesias 2023). Parameters related to mobility (frequency of aggregation, population size, migration rates, and frequency of visiting) were tested with additional model runs and are discussed in another analysis (see Padilla-Iglesias and Bischoff 2024). One of the key factors affecting the correlation between material culture and interaction networks is whether all agents start with the same types of pots and points or if each camp begins with its own unique set of traits. This significantly affects how well the material culture networks align with the interaction networks. In other words, does every agent make the same type of pot and point or are agents making different types of pots and points depending on the camp they belong to? The average graph correlation value between visiting interaction networks and point networks is 0.16 when the starting traits are the same versus 0.77 when the starting traits are unique per camp. The graph correlation for every agent starting with the same trait is almost nonexistent when compared to the strong correlation that exists when each camp has unique starting traits. Clearly, differences in material culture are necessary to use material culture networks as a representation of social interaction networks. For this reason, all results shown in this analysis, including the graph correlations shown previously, only include model runs with unique traits.
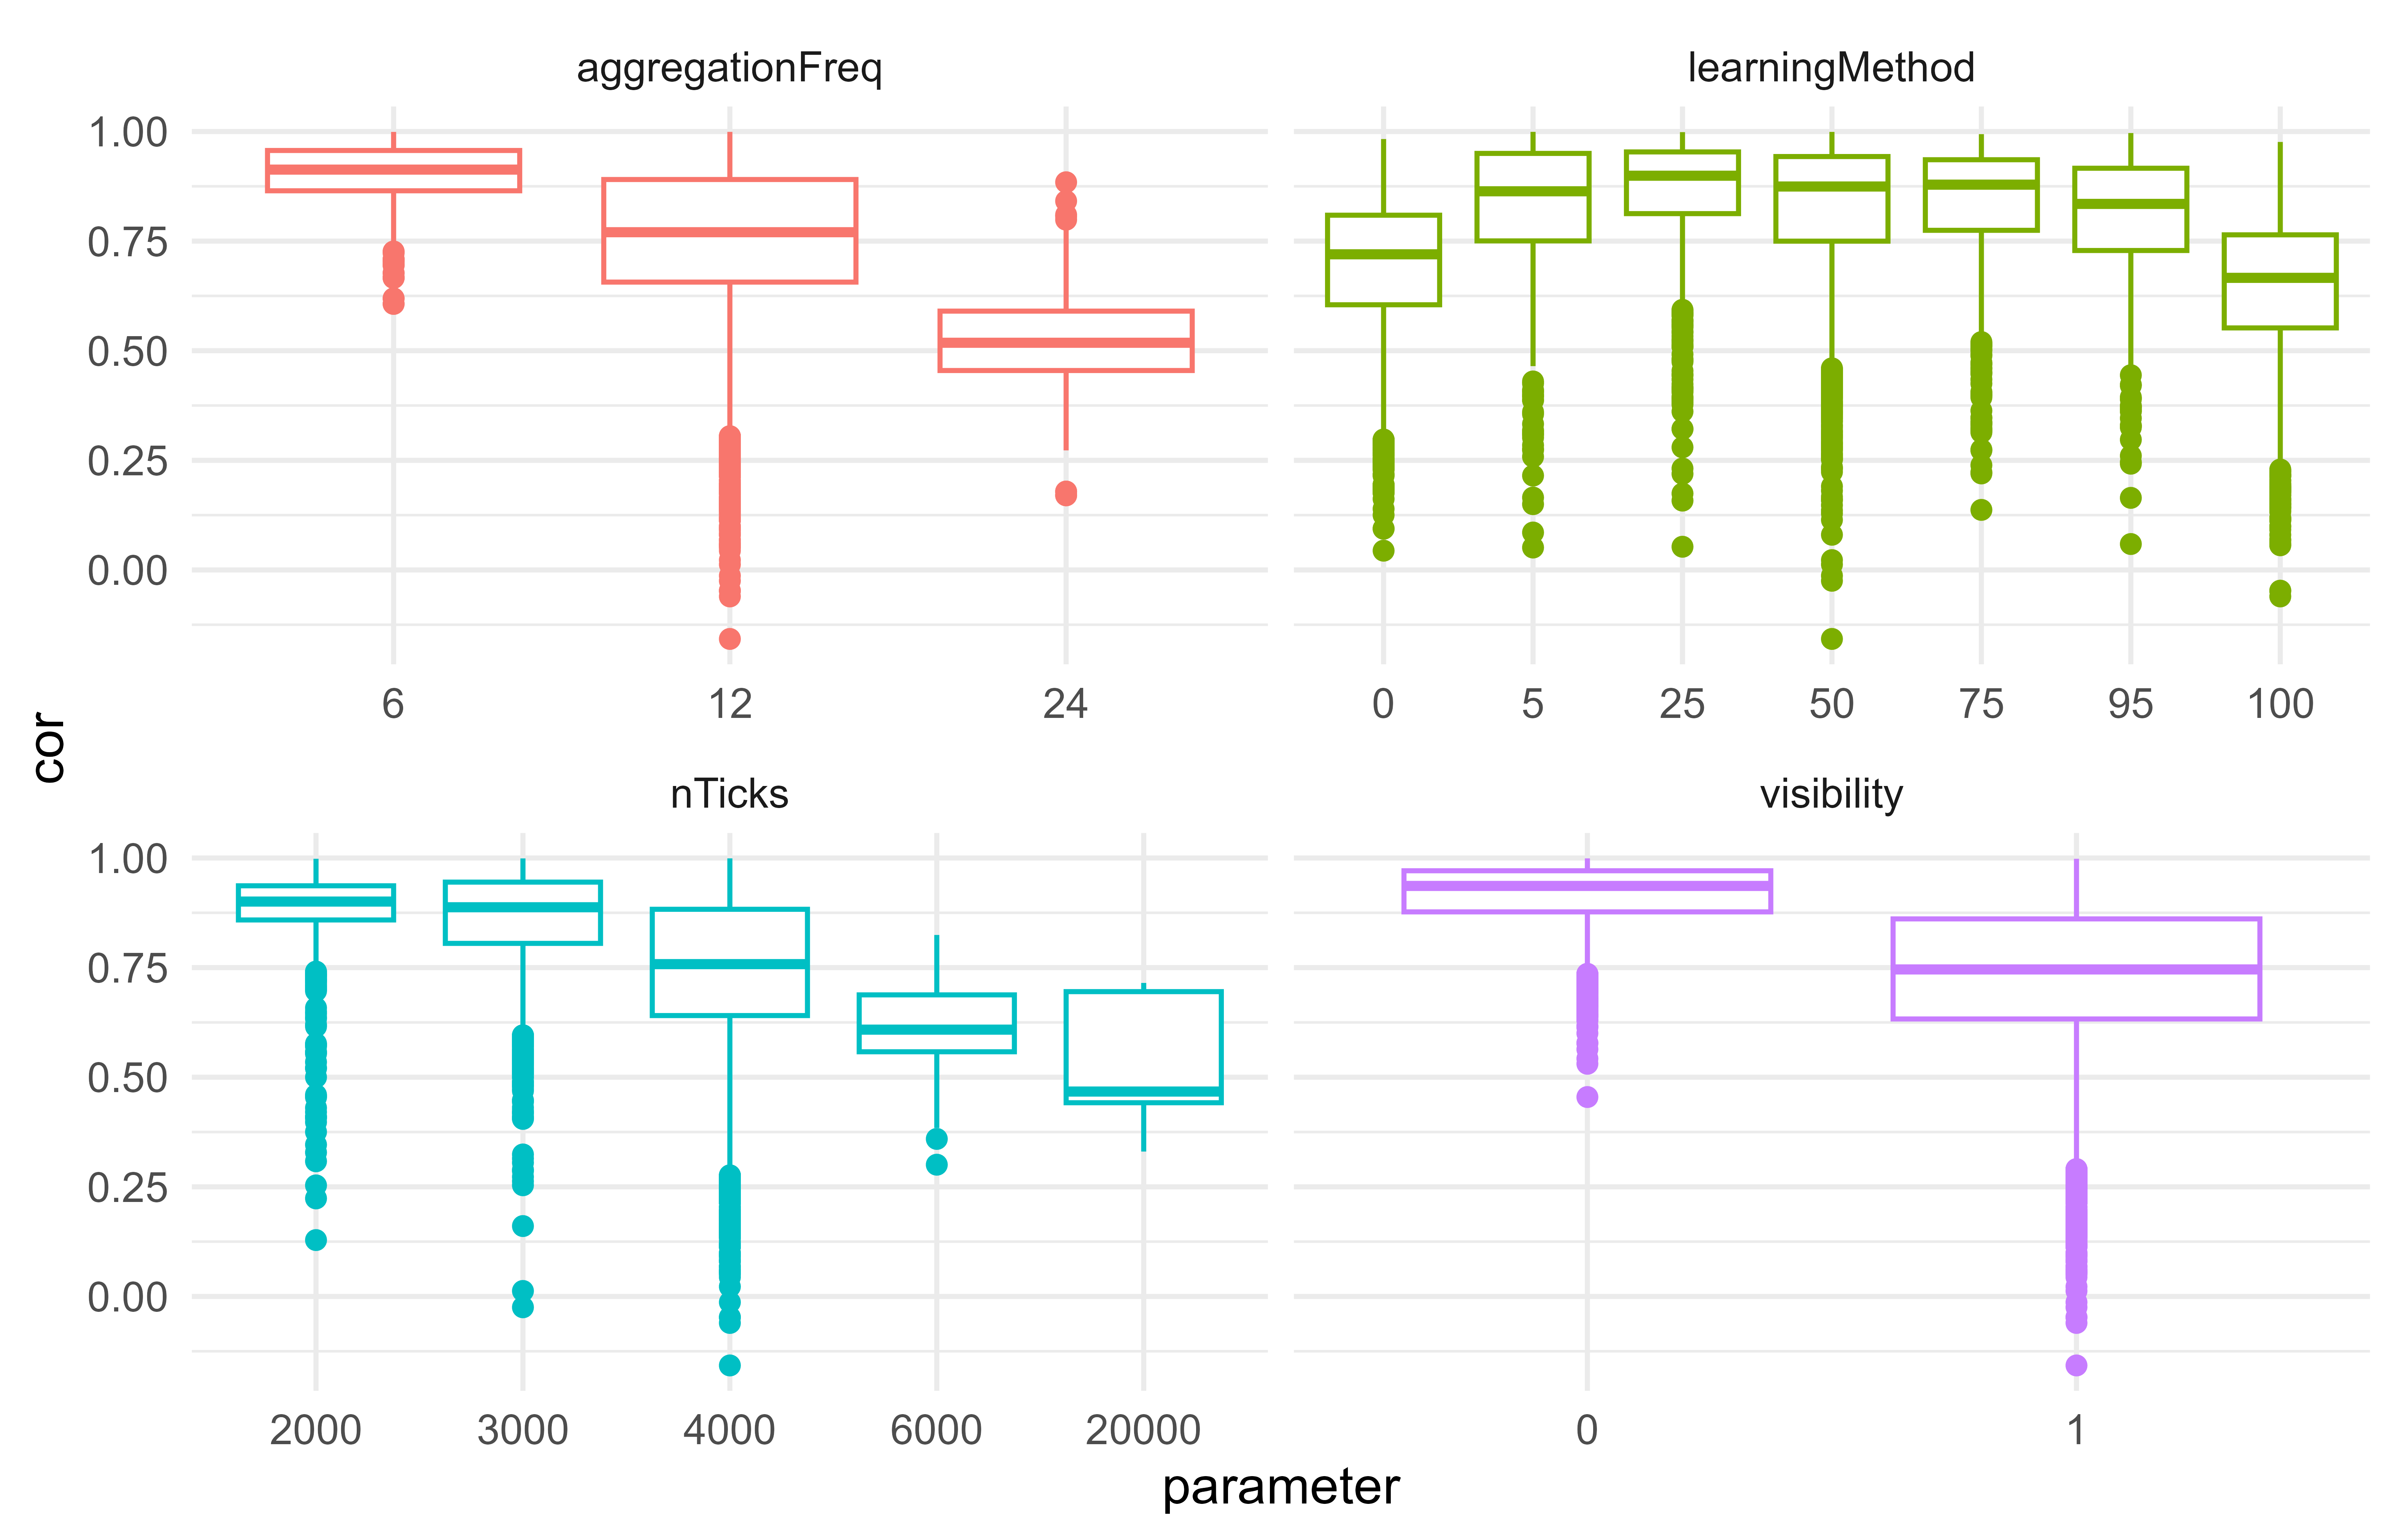
Determining a single parameter’s effect is challenging when multiple parameters are changed. One method for determining the effects of each parameter is to fit the model parameters and graph correlation values (the dependent variable) to a generalized additive model (GAM). GAMs can model complex, nonlinear relationships between dependent and independent variables and can also handle categorical and continuous predictors (Hastie and Tibshirani 1990). Thus, GAMs help us understand how different factors influence the strength of the relationship between social interactions and material culture. This makes a GAM a suitable tool for understanding the variables in the ArchMatNet model. There are 24 parameters that can be adjusted in ArchMatNet that impact model results. If all of these variables are included in a GAM (not including uniqueTraits which is set to 1–meaning bands start with different traits), the \(r^2\) result returned by the gam function in the mgcv (Wood 2017) package in R is 0.451 (full results can be viewed in Appendix A Table 2). Nearly half of the variance is explained by these parameters (the rest being the natural stochasticity in the model), but if most of the parameters are removed, the \(r^2\) value only drops to 0.372 with four remaining parameters: aggregationFreq, learningMethod, nTicks, and visibility. Only about 10 percent of the variance is lost by removing 19 parameters. This suggests that the model is not overly sensitive to most parameters. The variables that are highly sensitive are shown in Figure 2.4. The aggregationFreq variable controls how often bands come together to visit, hunt, trade, and learn. More interaction within bands appears to generate stronger correlations with the material culture networks. The learningMethod was ran as a factor in the gam model, as the values represent a continuum from 0 where all learning is based on conformism to 100 where all learning is based on prestige. A value of 50 indicates that learning is split between the two methods. As shown in Figure 2.4, the learningMethod has a nonlinear relationship where equal learning methods have the strongest correlations, but the correlation values decrease as the learning method leans towards one method or the other. Prestige learning does result in a slightly lower correlation than conformism. The nTicks parameter controls the number of time steps in the model. In this case, each time step, or tick, represents a one-month period. The shortest period, 2000 ticks, would represent nearly 167 years. The longer the model ran, the smaller the correlation values became. This indicates that material culture networks are less correlated over long timespans than shorter periods. The visibility parameter controls the likelihood that certain traits are copied. When visibility is 0 the correlation between networks is stronger. Thus, the introduction of low-visibility traits introduces more variability in the network comparison, although the relationship is still strong. Other variables that may have an impact–though smaller than those discussed here according to the GAM–include population size, and probabilities of interaction and learning. Regardless of the parameters, with the major exception of uniqueTraits, most runs of the model have significant correlations between the interaction networks and material culture networks.
2.4.3 ERGMs
The ERGM analysis was used to determine whether the interaction and material culture networks shared the same structural properties. As described earlier, ERGMs allow us to model the generative properties that create network structures. If similar generative structures match both types of networks then we can conclude that the networks are similar in structure. Three models were used in this analysis, each incorporating an edge parameter, which is a default for ERGM analyses since a network cannot exist without edges. Each model also includes a band parameter, which assigns each node (representing a camp) to a specific band. This is important because the band each camp belongs to affects interaction frequencies. The triangle parameter captures triadic structures where three nodes are all mutually connected, a common feature in networks. Note that the triangle model was attempted with only the edge and band parameter but in most cases the model failed to converge, which is a recognized issue in the ergm package. In this ABM, each band consists of three camps, always forming a triad of strong interactions. Two related parameters, GWESP (geometrically weighted edgewise shared partners) and threetrail (two-paths or three trails), are used to capture specific network structures. GWESP measures the likelihood that two nodes sharing a common partner will form a triangle. This parameter reflects the tendency for camps connected to the same camp to form direct links between themselves. The threetrail parameter, on the other hand, identifies network structures where three nodes are connected by two edges, without forming a triangle. It captures paths to triads through intermediate nodes and is used to detect strong connections between camps from different bands, helping to form a broader network structure. The three models together are:
- edge + band
- edge + gwesp + threetrail + band
- edge + triangle + threetrail + band
The fit of the ERGM models were assessed using the Akaike Information Criterion (AIC), which is a metric used to assess the quality of a model. Lower AIC values indicate a better model fit. We used a goodness-of-fit (GOF) test to evaluate how well the ERGM replicated the structural properties of the observed network and assess the adequacy of the models in reproducing key network features. ERGMs are computationally intensive. A random sample of 100 model runs was selected and each model run was fitted to the three models for each of the five types of networks returned from ArchMatNet (visiting, trading, learning, point, and pot). Each ERGM was run for the default 1024 iterations resulting in at least 2,000,000 total simulations depending on how many iterations each ERGM requires (between 1 and 60). Unfortunately, the ergm function in R has a tendency to fail when trying to replicate certain network structures and some ERGMs did not return results. A final note for the ERGMs is that they require binary networks. All network weights were binarized by calculating the 75th quantile for the edge weights and retaining links above that quantile. This is an arbitrary cutoff but it can be useful in identifying the structural relationships among the strongest ties (see Peeples and Roberts 2013).
Table 2.4 shows the results of the ERGM simulations. For clarity, only point and visiting networks are shown. Other networks return similar results and can be explored in the analysis code in the supplemental material or Appendix A. The GOF test indicates that all models performed well at capturing the structures of the network (1 equals a good fit and 0 a poor fit; GOF plots can be viewed in the supplementary material). This GOF test is useful for statistical validation of ERGM results. The AIC results indicate that both the gwesp and triangle parameters plus the threetrail and the default parameters fit the model well. These results are expected based on the triadic nature of the three camps within each band that each form strong connections with each other. The most important parameter appears to be the threetrail parameter. This parameter would matter in the ArchMatNet models because weaker ties between bands would be formed by some camps while other camps might lack those ties. The threetrail parameter shows that camps acting as intermediaries in the network is an important part of the network structure.
With a well-fitting ERGM model, we can now generate simulated networks that replicate the key structural properties of the observed network. We can then compare the correlation between simulated networks and the original network. A total of 10,000 simulations of a random visiting network compared to the original network return an average graph correlation of only 0.15. Of the 10,000 simulated networks, the highest correlation was 0.55. This is far from the near 1 correlation between interaction networks generated from ArchMatNet. A comparison of 10,000 simulated point networks to the original visiting network yields an average correlation of only 0.05 with a max of 0.5. These tests clearly demonstrate that the network correlations discussed previously are not likely chance occurrences.
| network | formula | gof | aic |
|---|---|---|---|
| point | edge + band | 0.98 | 104.43 |
| point | edge + gwesp + threetrail + band | 0.99 | 95.38 |
| point | edge + triangle + threetrail + band | 0.98 | 89.25 |
| visiting | edge + band | 0.98 | 106.64 |
| visiting | edge + gwesp + threetrail + band | 1.00 | 93.10 |
| visiting | edge + triangle + threetrail + band | 1.00 | 96.44 |
2.4.4 Network Centrality
Calculating centrality measures is often an important part of analyzing a network. We calculated the same centrality measures used by Golitko (2023): betwenness, closeness, degree, and eigenvector. The centrality results highlight a weakness of the ArchMatNet model. Because the network is fairly symmetrical (each camp has two strong connections forming a band and weak connections to camps in other bands) the centrality scores are all fairly identical. For example, the eigenvector centrality of a sample model run ranges from 0.15 to 0.24. This is a narrow range. The same network has a degree centrality range of 4.0 to 4.1. Likewise betweenness and closeness centraliy have narrow ranges. Because there is so little variation, the correlation between centrality scores for interaction networks and material culture networks is poor, ranging from approximately 0.2 to -0.2. Only model runs with 4 or more bands were used in an attempt to increase variation, but the number of bands appears to make little difference or even decrease the correlation between network centrality scores for interaction and material culture networks. This is an example of a limitation of a generalized ABM where the results cannot adequately represent empirical data.
2.4.5 Individual Networks
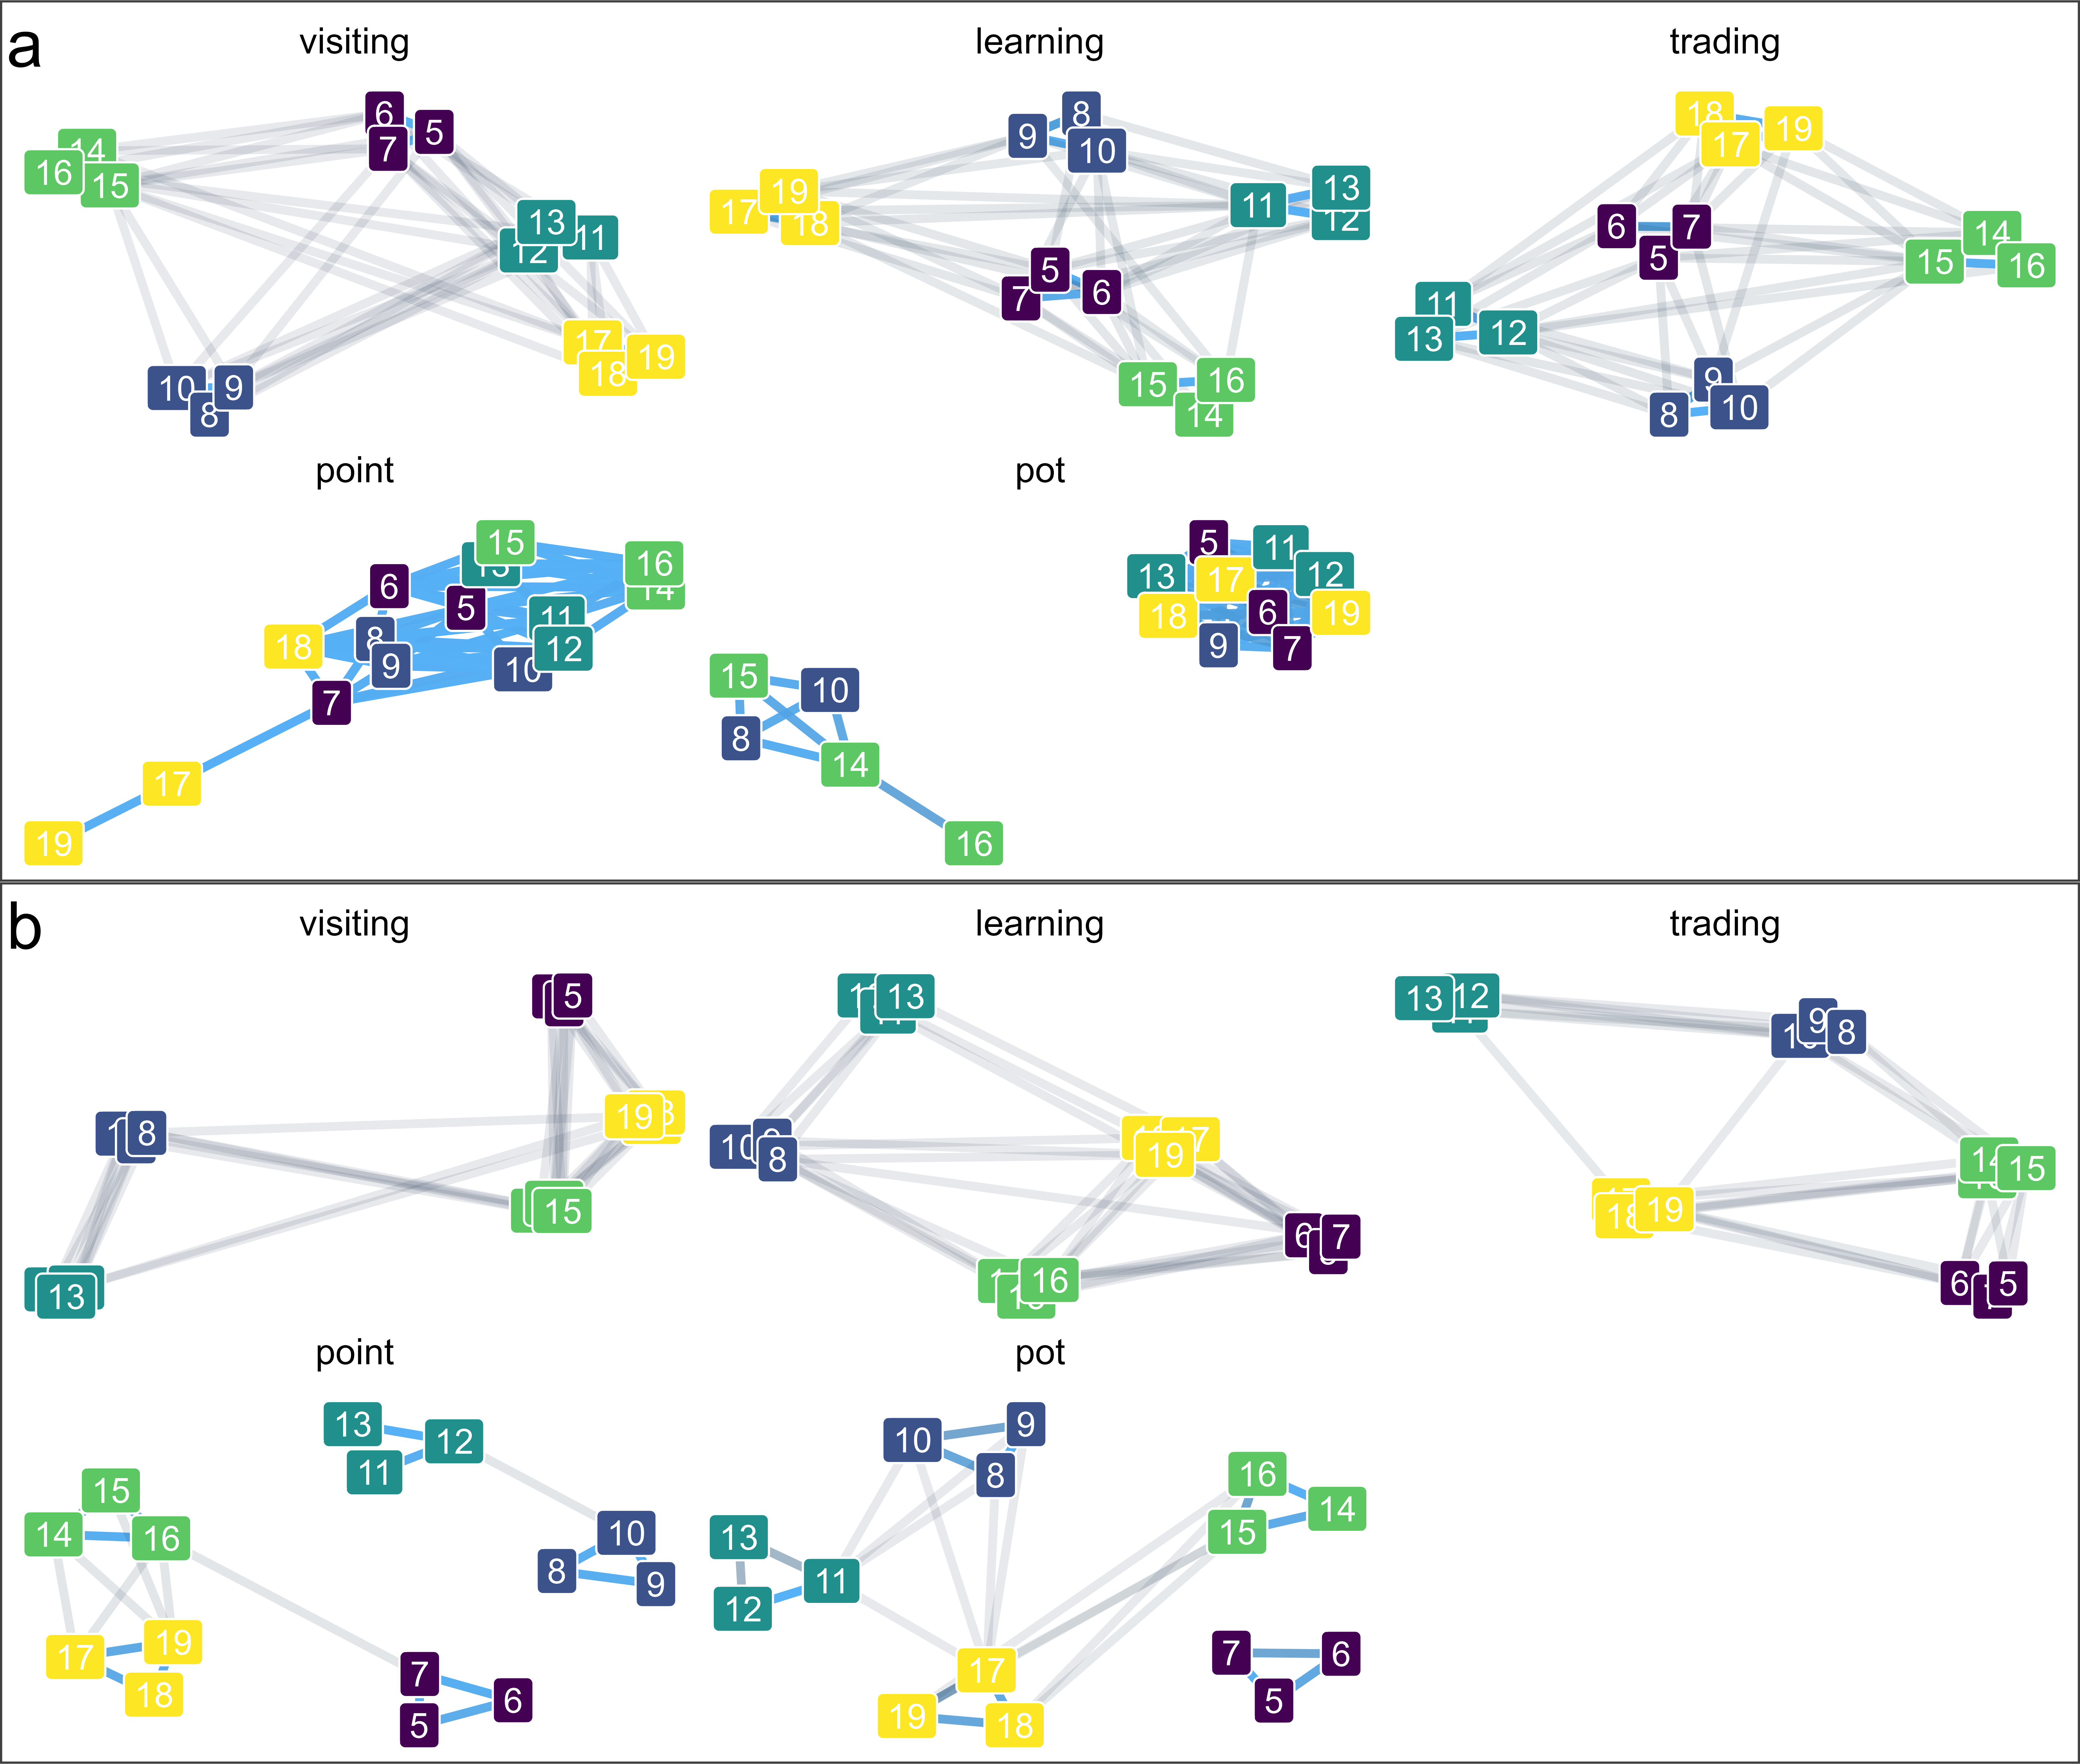
While comparing thousands of model runs is essential for statistical validity, it is useful to carefully examine individual networks to better understand the network structure. Figure 2.5 compares networks where uniqueTraits are set to false (a) and true (b)–meaning that in (a) everyone starts with the same traits and in (b) everyone in different camps has a different trait. Each of the five types of networks compared in this analysis are shown. The visiting, learning, and trading networks are all comparable across both model runs. There is a significant difference between the point and pot runs. For the networks that do not have unique starting traits, the point and pot networks are a jumbled mess. The network structure in no way resembles the interaction networks and in the case of the pot network, no differentiation is possible at all, even with only the strongest 50% of links shown in the network graphs. On the other hand, the pot and point networks with unique starting traits closely resemble the interaction networks. All of the intra-band triads are represented. There are a number of differences in the weaker connections between camps and bands. Besides the necessity of having material culture networks with enough variation, the point and pot networks with unique starting traits demonstrate that these networks struggle with exact replication of weaker links. Figure 2.3 shows that the pot and point networks had the weakest correlations (although they were still high). Caution should be applied when interpreting weak connections between networks based on material culture. These weak connections can be important parts of network analysis, but material culture may not always be adequate for determining specific weak relationships between nodes. The final observation of these networks, is that the point and pot networks exhibit some differences. There are different generative processes involved while the major relationships are the same. It appears a more complete picture could be created by combining the pot and point networks, meaning interaction can be better represented by multiple types of material culture.
2.5 Conclusion
This study has highlighted the utility of the ArchMatNet agent-based model for understanding the dynamic relationships between social interaction and material culture networks. By simulating these networks under varied conditions and analyzing the results using graph correlations, generalized additive models (GAMs), Exponential Random Graph Models (ERGMs), and other methods, we have attempted to provide a deeper understanding of how material culture can serve as a proxy for social interactions. Our most important findings can be summarized into three main points. (1) Material culture networks (i.e., network representations based on similarities in artifacts between camps) can be good representations of social interaction networks (i.e., counts of interactions between individuals from different camps), provided there is sufficient variation in the material culture given the affects of the uniqueTraits parameter. We have not attempted to qualify how much variation in material culture is necessary. This is a potential avenue of future research but may depend on regional and temporal contingencies. Overall, the correlations between interaction networks and material culture networks were strong and highly significant (see the graph correlation and QAP results). (2) Material culture networks are inherently fuzzier than social interaction networks (see, in particular, Figure 2.3 and Figure 2.5). The connections between material culture networks and social interaction networks were not as strong as those between different types of interaction networks, suggesting that using artifacts to map social interactions can sometimes blur or weaken the relationships we see. This is an expected result but one that network analysts should always keep in mind. Strong relationships may appear weaker when viewed through material culture, or weak or non-existent relationships may appear stronger. Viewing social networks through a material culture lens in effect has a smoothing effect on the strength of relationships. We did find that the strongest relationships tended to remain relatively strong in both interaction and material culture networks. (3) Different types of material culture can produce different results. While the point and pot networks exhibited strong similarities, close comparisons (see Figure 2.5) demonstrated notable differences in which bands had the strongest inter-band ties. The use of multiple types of material culture appears to provide a more accurate representation of interaction networks.
The model results also show that despite the stochastic nature of agent-based models, certain parameters consistently had a significant impact on the correlation between social and material networks. Specifically, factors such as the frequency of aggregation, learning methods, the number of time steps, and the visibility of traits play critical roles in shaping these networks. As band members interact more frequently, their material culture networks tend to show stronger correlations with their social interaction networks. This reinforces the idea that material culture is most reflective of social ties when there is consistent and repeated interaction between groups. The sensitivity of the model to the learning method parameter also underscores the importance of how information is transmitted within the community. Gravel-Miguel (2017) found that even low rates of cultural transmission produced similarities between reconstructed and observed social networks. The non-linear relationship between the learning method (whether conformist or prestige-based) and network correlations suggests that a balance between these learning strategies produces the strongest correlations. There is an interesting correlation with ethnographic studies of cultural transmission that indicate mixed models of prestige and conformism also do best (Chudek et al. 2012; Henrich and Boyd 1998; Henrich and Broesch 2011; Henrich and McElreath 2003). There are different mechanisms in play in the ethnographic studies than the ArchMatNet model. In the ABM, low levels of prestige transmission appear to reduce the spread of traits, while high levels of prestige transmission causes too much transmission for the material culture to adequately represent the social processes. The mechanisms are related for the ethnographic studies in that conformism helps maintain distinct cultural identities while prestige allows for the spread of advantageous traits. The visibility of cultural traits also emerges as a critical factor as enabling the differential learning of traits based on their visibility decreases the correlation between interaction and material culture networks. This suggests that the visibility of traits can introduce variability into the network, which may be important for understanding the dynamics of social and material culture networks. While the current output of the ArchMatNet model does not provide the opportunity to investigate the specifics of how high- and low-visibility traits independently affect correlations between material culture and interaction networks, future investigations will better be able to understand these interactions.
The use of ERGMs allowed us to model structural dependencies within the network, showing that triadic closure and intermediary paths play key roles in the structure of both the interaction and material culture networks. Essentially, the ERGM results demonstrate that both networks have similar generative structures. ERGMs also allow for statistical validation of the model through the use of simulated networks with the same structural properties as the actual network. This method of network validation can be used in a variety of network applications.
While the results of this study suggest that the ArchMatNet model is a powerful tool for investigating the relationship between social and material culture networks, they also highlight certain limitations. The largest limitation is the symmetry in the network structure that does not generate enough variation in network centrality to make a useful comparison between networks. Future research should prioritize the emphasis of long-distance ties. Something this model does not consider is that sometimes the avoidance of a camp can be just as important as seeking out a camp to visit. People can have many reasons to visit a particular camp or to avoid visiting another camp. Including preferential node attachment (increasing the inter-band connections between some camps) while ensuring other nodes avoid each other will create more variation and provide a better opportunity to evaluate the structural position of nodes in the network.
In summary, the findings from the ArchMatNet model provide valuable insights into the relationships between social and material culture networks. The model demonstrates that, while material culture networks often serve as good proxies for social networks, certain factors—particularly the frequency of interaction, learning strategies, and trait visibility—play crucial roles in determining the strength of this relationship. These results emphasize the importance of carefully considering the parameters that shape these networks in both archaeological interpretations and agent-based modeling. As such, the ArchMatNet model not only contributes to our understanding of past social dynamics but also offers a methodological framework for future research in this area, highlighting the potential for ABMs to simulate complex, emergent social phenomena.
Acknowledgements
Claudine Gravel-Miguel contributed equally to the creation of ArchMatNet with the authors of this paper (see Appendix E for permissions). Matthew Peeples, Michelle Hegmon, and Michael Barton provided guidance and feedback that greatly improved the final product.
Data Availability
The ArchMatNet model is peer-reviewed and can be found here along with its ODD description: https://doi.org/10.25937/08kx-4f24. Supplementary material can be found in an OSF (Open Science Foundation) repository here: https://doi.org/10.17605/OSF.IO/DE3VQ.
Note: This paper was co-authored by Cecilia Padilla-Iglesias and is intended for publication in Plos ONE.
Amati, V., Mol, A. A. A., Shafie, T., Hofman, C. L., & Brandes, U. (2020). A Framework for Reconstructing Archaeological Networks Using Exponential Random Graph Models. Journal of Archaeological Method and Theory, 27, 192–219. https://doi.org/10.1007/s10816-019-09423-z
Barton, C. M., & Riel-Salvatore, J. (2014). The Formation of Lithic Assemblages. Journal of Archaeological Science, 46, 334–352. https://doi.org/10.1016/j.jas.2014.03.031
Barton, C. M., Riel-Salvatore, J., Anderies, J. M., & Popescu, G. (2011). Modeling Human Ecodynamics and Biocultural Interactions in the Late Pleistocene of Western Eurasia. Human Ecology, 39, 705–725. https://doi.org/10.1007/s10745-011-9433-8
Bischoff, R. J., & Padilla-Iglesias, C. (2023). A description and sensitivity analysis of the ArchMatNet agent-based model. PeerJ Computer Science, 9, e1419. https://doi.org/10.7717/peerj-cs.1419
Bischoff, R. J., Padilla-Iglesias, C., & Gravel-Miguel, C. (2024). Evaluating the Effects of Randomness on Missing Data in Archaeological Networks. Accepted to CAA 2021 Conference: Limassol, Cyprus. https://doi.org/10.31235/osf.io/vdy9b
Borgatti, S. P. (2005). Centrality and Network Flow. Social Networks, 27, 55–71. https://doi.org/10.1016/j.socnet.2004.11.008
Brandes, U., Robins, G., McCranie, A., & Wasserman, S. (2013). What is Network Science? Network Science, 1, 1–15. https://doi.org/10.1017/nws.2013.2
Brantingham, P. J. (2003). A Neutral Model of Stone Raw Material Procurement. American Anthropologist, 68, 487–509.
Brughmans, T., Keay, S., & Earl, G. (2014). Introducing exponential random graph models for visibility networks. Journal of archaeological science, 49, 442–454. https://doi.org/10.1016/j.jas.2014.05.027
Brughmans, T., & Peeples, M. (2017). Trends in Archaeological Network Research: A Bibliometric Analysis. Journal of Historical Network Research, 1, 1–24. https://doi.org/10.25517/jhnr.v1i1.10
Brughmans, T., & Peeples, M. A. (2023). Network Science in Archaeology. Cambridge University Press.
Brughmans, T., & Poblome, J. (2016). Roman bazaar or market economy? Explaining tableware distributions through computational modelling. Antiquity, 90, 393–408. https://doi.org/10.15184/aqy.2016.35
Butts, C. T. (2023). sna: Tools for Social Network Analysis. https://CRAN.R-project.org/package=sna
Carr, C. (1995b). A Unified Middle-Range Theory of Artifact Design. In C. C. & J. E. Neitzel (Eds.), Style, Society, and Person (pp. 171–258). Boston: Springer. https://doi.org/10.1007/978-1-4899-1097-4_6
Carr, C. (1995a). Building a Unified Middle-Range Theory of Artifact Design. In C. Carr & J. E. Neitzel (Eds.), Style, Society, and Person (pp. 151–170). Boston: Springer. https://doi.org/10.1007/978-1-4899-1097-4_6
Cegielski, W. H. (2024). Networks, Agent-Based Modeling, and Archaeology. In T. Brughmans, B. J. Mills, M. A. Peeples, & J. Munson (Eds.), The Oxford Handbook of Archaeological Network Research (pp. 280–293). Oxford, England: Oxford University Press.
Chudek, M., Heller, S., Birch, S., & Henrich, J. (2012). Prestige-biased cultural learning: bystander’s differential attention to potential models influences children’s learning. Evolution and human behavior: official journal of the Human Behavior and Evolution Society, 33, 46–56. https://doi.org/10.1016/j.evolhumbehav.2011.05.005
Clark, J. J. (2001). Tracking Prehistoric Migrations: Pueblo Settlers Among the Tonto Basin Hohokam (Vol. 65). Tucson: University of Arizona Press. https://play.google.com/store/books/details?id=27Tk3xNT-6UC
Collar, A., Coward, F., Brughmans, T., & Mills, B. J. (2015). Networks in Archaeology: Phenomena, Abstraction, Representation. Journal of Archaeological Method and Theory, 22, 1–32. https://doi.org/10.1007/s10816-014-9235-6
Crabtree, S. A. (2015). Inferring Ancestral Pueblo Social Networks from Simulation in the Central Mesa Verde. Journal of Archaeological Method and Theory, 22, 144–181. https://doi.org/10.1007/s10816-014-9233-8
Creanza, N., Kolodny, O., & Feldman, M. W. (2017). Greater than the Sum of Its Parts? Modelling Population Contact and Interaction of Cultural Repertoires. Journal of the Royal Society, Interface / the Royal Society, 14, 20170171. https://doi.org/10.1098/rsif.2017.0171
Dietler, M., & Herbich, I. (1998). Habitus, Techniques, Style: An Integrated Approach to the Social Understanding of Material Culture and Boundaries. In M. T. Stark (Ed.), The Archaeology of Social Boundaries (pp. 232–263). Washington, DC: Smithsonian Institution.
Drennan, R. D. (1984). Long-distance transport costs in pre-Hispanic Mesoamerica. American anthropologist, 86, 105–112. https://doi.org/10.1525/aa.1984.86.1.02a00100
Epstein, J. M. (2006). Generative Social Science: Studies in Agent-Based Computational Modeling. Princeton University Press. https://play.google.com/store/books/details?id=T8_zh3F7rMIC
Feinman, G. M., & Neitzel, J. E. (2020). Excising Culture History from Contemporary Archaeology. Journal of Anthropological Archaeology, 60, 101230. https://doi.org/10.1016/j.jaa.2020.101230
Fraser, D. (1980). The Cutpoint Index: A Simple Measure of Point Connectivity. Area, 12, 301–304.
Gjesfjeld, E. (2015). Network Analysis of Archaeological Data from Hunter-Gatherers: Methodological Problems and Potential Solutions. Journal of Archaeological Method and Theory, 22, 182–205. https://doi.org/10.1007/s10816-014-9232-9
Golitko, M. (2023). A performance test of archaeological similarity-based network inference using New Guinean ethnographic data. Journal of Anthropological Archaeology, 72, 101550. https://doi.org/10.1016/j.jaa.2023.101550
Gosselain, O. P. (2000). Materializing Identities: An African Perspective. Journal of Archaeological Method and Theory, 7, 187–217. https://doi.org/10.1023/A:1026558503986
Gravel-Miguel, C. (2017). The Impacts of Geography and Climate Change on Magdalenian Social Networks (PhD thesis). PhD dissertation, School of Human Evolution; Social Change, Arizona State University, Tempe. Retrieved from http://hdl.handle.net/2286/R.I.44052
Gravel-Miguel, C., & Coward, F. (2024). Palaeolithic Social Networks and Behavioural Modernity. In M. A. Peeples, J. Munson, B. Mills, & T. Brughmans (Eds.), The Oxford Handbook of Archaeological Network Research (pp. 443–458). Oxford: Oxford University Press.
Handcock, M. S., Hunter, D. R., Butts, C. T., Goodreau, S. M., Krivitsky, P. N., & Morris, M. (2018). ergm: Fit, Simulate and Diagnose Exponential-Family Models for Networks. The Statnet Project (http://www.statnet.org). https://CRAN.R-project.org/package=ergm
Hastie, T. J., & Tibshirani, R. J. (1990). Generalized additive models. London: Chapman; Hall.
Hegmon, M. (1992). Archaeological Research on Style. Annual Review of Anthropology, 21, 517–536. https://doi.org/10.1146/annurev.anthro.21.1.517
Henrich, J. (2004). Cultural Group Selection, Coevolutionary Processes and Large-Scale Cooperation. Journal of theoretical biology, 220, 577–590.
Henrich, J., & Boyd, R. (1998). The Evolution of Conformist Transmission and the Emergence of Between-Group Differences. Evolution and Human Behavior, 19, 215–241. https://doi.org/10.1016/S1090-5138(98)00018-X
Henrich, J., & Broesch, J. (2011). On the nature of cultural transmission networks: evidence from Fijian villages for adaptive learning biases. Philosophical transactions of the Royal Society of London. Series B, Biological sciences, 366, 1139–1148. https://doi.org/10.1098/rstb.2010.0323
Henrich, J., & McElreath, R. (2003). The evolution of cultural evolution. Evolutionary anthropology, 12, 123–135. https://doi.org/10.1002/evan.10110
Hodder, I. (1982). Symbols in Action: Ethnoarchaeological Studies of Material Culture. Cambridge: Cambridge University Press. https://market.android.com/details?id=book-TSE9AAAAIAAJ
Holland-Lulewicz, J. (2021). From Categories to Connections in the Archaeology of Eastern North America. Journal of Archaeological Research, 29, 537–579. https://doi.org/10.1007/s10814-020-09154-w
Hunter, D. R., Handcock, M. S., Butts, C. T., Goodreau, S. M., & Morris, M. (2008). ergm: A Package to Fit, Simulate and Diagnose Exponential-Family Models for Networks. Journal of Statistical Software, 24, 1–29.
Huntley, D. L. (2008). Ancestral Zuni Glaze-Decorated Pottery: Viewing Pueblo IV Regional Organization through Ceramic Production and Exchange (Vol. No. 72). Tucson: University of Arizona Press.
Jennewein, D. M., Lee, J., Kurtz, C., Dizon, W., Shaeffer, I., Chapman, A., et al. (2023). The Sol Supercomputer at Arizona State University. In Practice and Experience in Advanced Research Computing (pp. 296–301). New York, NY, USA: Association for Computing Machinery. https://doi.org/10.1145/3569951.3597573
Krackardt, D. (1987). QAP Partialling as a Test of Spuriousness. Social Networks, 9, 171–186. https://doi.org/10.1016/0378-8733(87)90012-8
Lemonnier, P. (1986). The Study of Material Culture Today: Toward an Anthropology of Technical Systems. Journal of Anthropological Archaeology, 5, 147–186. https://doi.org/10.1016/0278-4165(86)90012-7
Lyons, P. D. (2003). Ancestral Hopi Migrations (First Edition edition.). Tucson: University of Arizona Press.
Mills, B. J., Clark, J. J., Peeples, M. A., Haas, W. R., Roberts, J. M., Hill, J. B., et al. (2013). Transformation of social networks in the late pre-Hispanic US Southwest. Proceedings of the National Academy of Sciences of the United States of America, 110, 5785–5790. https://doi.org/10.1073/pnas.1219966110
Morgan, T. J. H., Cross, C. P., & Rendell, L. E. (2015). Nothing in human behavior makes sense except in the light of culture: Shared interests of social psychology and cultural evolution. In Evolutionary Perspectives on Social Psychology (pp. 215–228). Cham: Springer International Publishing. https://doi.org/10.1007/978-3-319-12697-5_17
Muthukrishna, M., Morgan, T. J. H., & Henrich, J. (2016). The when and who of social learning and conformist transmission. Evolution and human behavior: official journal of the Human Behavior and Evolution Society, 37, 10–20. https://doi.org/10.1016/j.evolhumbehav.2015.05.004
Neuzil, A. A. (2008). In the Aftermath of Migration: Renegotiating Ancient Identity in Southeastern Arizona. Tucson: University of Arizona Press.
Padilla-Iglesias, C., & Bischoff, R. J. (2024). Hunter-gatherer mobility patterns influence the reconstruction of social networks from archaeological assemblages. Journal of Archaeological Science: Reports, 59, 104798. https://doi.org/10.1016/j.jasrep.2024.104798
Peeples, M. A. (2018). Connected Communities: Networks, Identity, and Social Change in the Ancient Cibola World. Tucson: University of Arizona Press. https://market.android.com/details?id=book-fyw-DwAAQBAJ
Peeples, M. A. (2019). Finding a Place for Networks in Archaeology. Journal of Archaeological Research, 1–49. https://doi.org/10.1007/s10814-019-09127-8
Peeples, M. A., & Brughmans, T. (2023). Online Companion to Network Science in Archaeology. https://archnetworks.ne
Peeples, M. A., Mills, B. J., Haas, W. R. J., Clark, J. J., & Roberts, J. M. J. (2016). Analytical Challenges for the Application of Social Network Analysis in Archaeology. In T. Brughmans, A. Collar, & F. Coward (Eds.), The Connected Past: Challenges to Network Studies in Archaeology and History (pp. 59–84). Oxford: Oxford University Press.
Peeples, M. A., Roberts, J., John M, & Yin, Y. (2024). Challenges for network research in archaeology. In M. A. Peeples, J. Munson, B. Mills, & T. Brughmans (Eds.), The Oxford Handbook of Archaeological Network Research (pp. 34–49). Oxford University Press. https://doi.org/10.1093/oxfordhb/9780198854265.013.2
Peeples, M. A., & Roberts, J. M. (2013). To Binarize or not to Binarize: Relational Data and the Construction of Archaeological Networks. Journal of Archaeological Science, 40, 3001–3010. https://doi.org/10.1016/j.jas.2013.03.014
Premo, L. S. (2006). Agent-Based Models as Behavioral Laboratories for Evolutionary Anthropological Research. Arizona Anthropologist, 17, 91–113.
Prignano, L., Morer, I., & Diaz-Guilera, A. (2017). Wiring the Past: A Network Science Perspective on the Challenge of Archeological Similarity Networks. Frontiers in Digital Humanities, 4. https://doi.org/10.3389/fdigh.2017.00013
Rogers, J. D., & Cegielski, W. H. (2017). Building a better past with the help of agent-based modeling. Proceedings of the National Academy of Sciences of the United States of America, 114, 12841–12844. https://doi.org/10.1073/pnas.1718277114
Romanowska, I., Crabtree, S. A., Harris, K., & Davies, B. (2019). Agent-Based Modeling for Archaeologists: Part 1 of 3. Advances in Archaeological Practice, 7, 178–184. https://doi.org/10.1017/aap.2019.6
Romanowska, I., Wren, C. D., & Crabtree, S. A. (2021). Agent-Based Modeling for Archaeology: Simulating the Complexity of Societies. Santa Fe: The Santa Fe Institute Press.
Sackett, J. R. (1982). Approaches to Style in Lithic Archaeology. Journal of Anthropological Archaeology, 1, 59–112.
Sackett, James R. (1986). Isochrestism and style: A clarification. Journal of anthropological archaeology, 5, 266–277. https://doi.org/10.1016/0278-4165(86)90008-5
Scheidel, W. (2014). The Shape of the Roman World: Modelling Imperial Connectivity. Journal of Roman Archaeology, 27, 7–32. https://doi.org/10.1017/S1047759414001147
Sindbæk, S. M. (2007). Networks and nodal points: the emergence of towns in early Viking Age Scandinavia. Antiquity, 81, 119–132. https://doi.org/10.1017/s0003598x00094886
Team, R Core. (2024). R: A Language and Environment for Statistical Computing. Vienna, Austria: R Foundation for Statistical Computing. https://www.R-project.org/
Terrell, John E. (1977). Human Biogeography in the Solomon Islands. Fieldiana, 68, 1–47.
Terrell, John Edward, Golitko, M., Dawson, H., & Kissel, M. (2023). Modeling the Past: Archaeology, History, and Dynamic Networks. Berghahn Books. https://play.google.com/store/books/details?id=ziWBEAAAQBAJ
Van Oyen, A. (2016). Historicising Material Agency: from Relations to Relational Constellations. Journal of Archaeological Method and Theory, 23, 354–378. https://doi.org/10.1007/s10816-015-9244-0
Wang, L.-Y., & Marwick, B. (2021). A Bayesian networks approach to infer social changes from burials in northeastern Taiwan during the European colonization period. Journal of Archaeological Science, 134, 105471. https://doi.org/10.1016/j.jas.2021.105471
Wenger, E. (1998). Communities of Practice: Learning, Meaning, and Identity (Vol. 9). Cambridge: Cambridge University Press. https://valenciacollege.edu/faculty/development/teaching-learning-academy/documents/CommunityofPractice.pdf
White, A. (2013). An Abstract Model Showing That the Spatial Structure of Social Networks Affects the Outcomes of Cultural Transmission Processes. Journal of Artificial Societies and Social Simulation, 16. https://doi.org/10.18564/jasss.2219
Wiessner, P. (1983). Style and Social Information in Kalahari San Projectile Points. American Antiquity, 48, 253–276. https://doi.org/10.2307/280450
Wiessner, P. (1985). Style or Isochrestic Variation? A Reply to Sackett. American Antiquity, 50, 160–166. https://doi.org/10.2307/280643
Wobst, H. M. (1977). Stylistic Behavior and Information Exchange. In C. E. Cleland (Ed.), For the Director: Research Essays in Honour of the Late James B.Griffin (Vol. 61, pp. 317–342). Ann Arbor: University of Michigan.
Wood, S. N. (2017). Generalized Additive Models: An Introduction with R. Chapman; Hall/CRC.