Automated NetLogo Flowcharts in R

NetLogo
NetLogo is a popular tool for building agent based models. A helpful group has built a nice R package for interfacing with NetLogo called NLRX. One of the functions that is really fun to play with is the nldoc_network function. It builds an igraph object using the NetLogo code that graphs the procedure calls in the model.
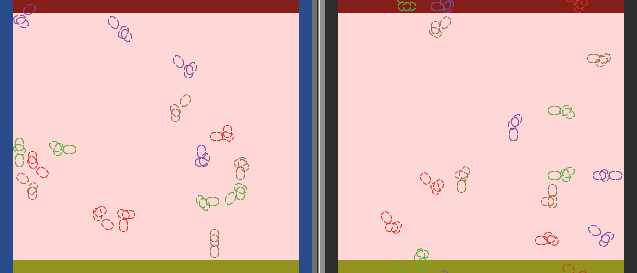
We’ll use the Bacterial Infection model as an example.
We need to first find the directory it is in. This will vary by operating system and version. Then we can call the function and get an igraph network.
library(nlrx, quietly = T, warn.conflicts = F)
dir = "C:\\Program Files\\NetLogo 6.2.2\\app\\models\\Sample Models\\Biology\\Evolution"
model = file.path(dir,"Bacterial Infection.nlogo")
nw = nldoc_network(model)
nw
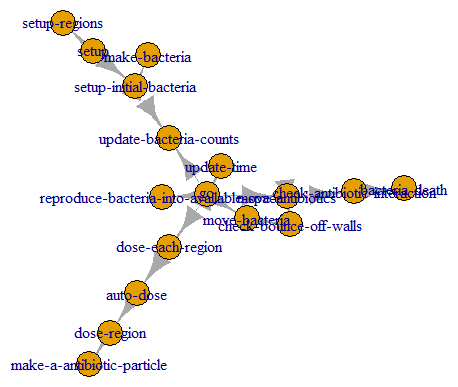
We can plot it with igraph.
plot(nw)
Flowcharts
Typically, we don’t present a graph like this when we’re writing about our models. We need something like a flowchart. A flowchart is a kind of graph, but it has a bit more structure. How can we turn this graph into a flowchart?
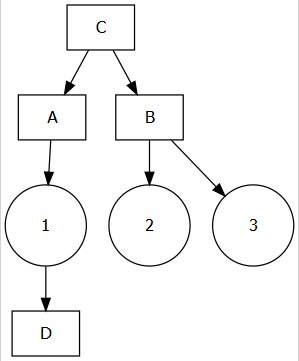
The diagrammeR package has all of the necessary tools, but the syntax has to be written out in a form like this:
library(DiagrammeR, quietly = T, warn.conflicts = F)
grViz("
digraph boxes_and_circles {

  # a 'graph' statement
  graph [overlap = true, fontsize = 10]

  # several 'node' statements
  node [shape = box,
        fontname = Helvetica]
  A; B; C; D;

  node [shape = circle,
        fixedsize = true,
        width = 0.9] // sets as circles
  1; 2; 3;

  # several 'edge' statements
  A->1 B->2 B->3 C->A
  1->D C->B
}
")
Writing it out like this kind of kills the fun in automatically building our flowchart from the code. But really this is just a character string, so we can paste or glue together what we need without having to type it out.
We can extract a dataframe from our igraph object easily enough. Note: in this model the procedure names use a hyphen, which is common in NetLogo (although I don’t recommend it). The hyphen is a special character in GraphViz (the underlying software we are using in diagrammeR), so we will just remove it.
library(igraph, quietly = T, warn.conflicts = F)
library(dplyr, quietly = T, warn.conflicts = F)
library(stringr, quietly = T, warn.conflicts = F)
edges = igraph::as_data_frame(nw) %>%
  mutate_all(str_remove_all,pattern = "-")
nodes = V(nw)$name %>% str_remove_all("-")
We will then use a combination of paste and map (the glue package caused a conflict with the github pages build on my website) to format our edges and nodes into the proper shape.
library(purrr, quietly = T, warn.conflicts = F)
diagram = paste("
  digraph {
      graph []

      node []
  ",paste(nodes,collapse = '; '),"

  ",paste(map2_chr(edges$from,edges$to,function(x,y)paste0(c(x,y), collapse = '->')),collapse = ' '),"
      }"
)
grViz(diagram)
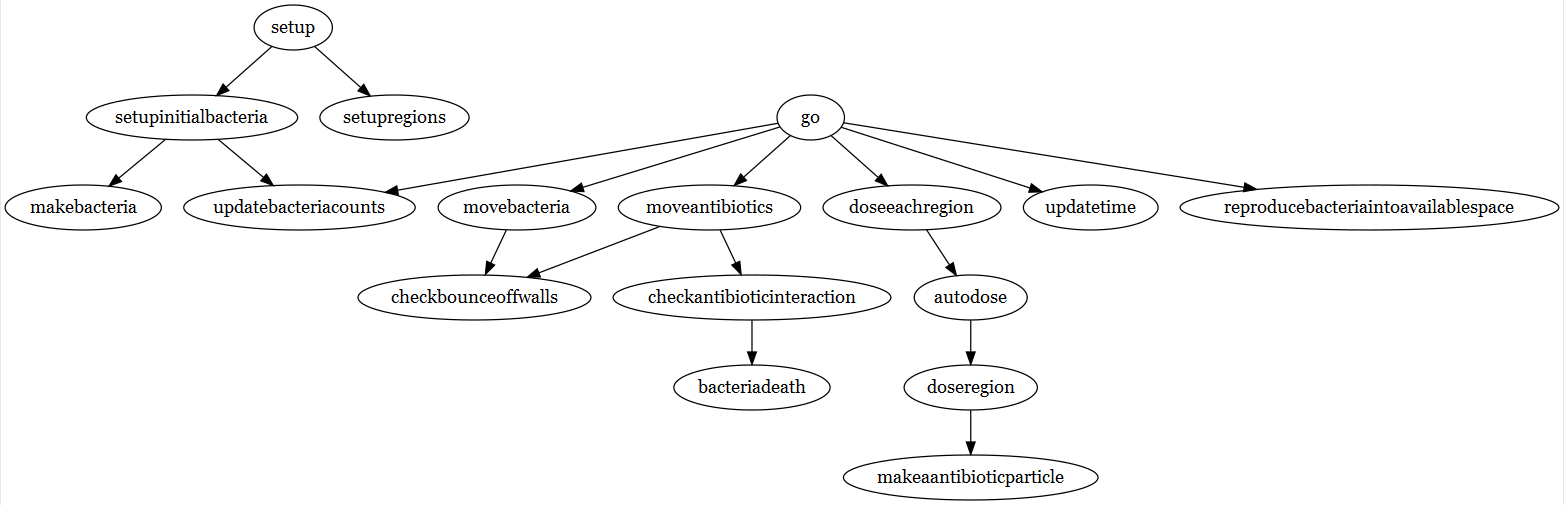
Already this looks like a much better graph visualization than what we had before.
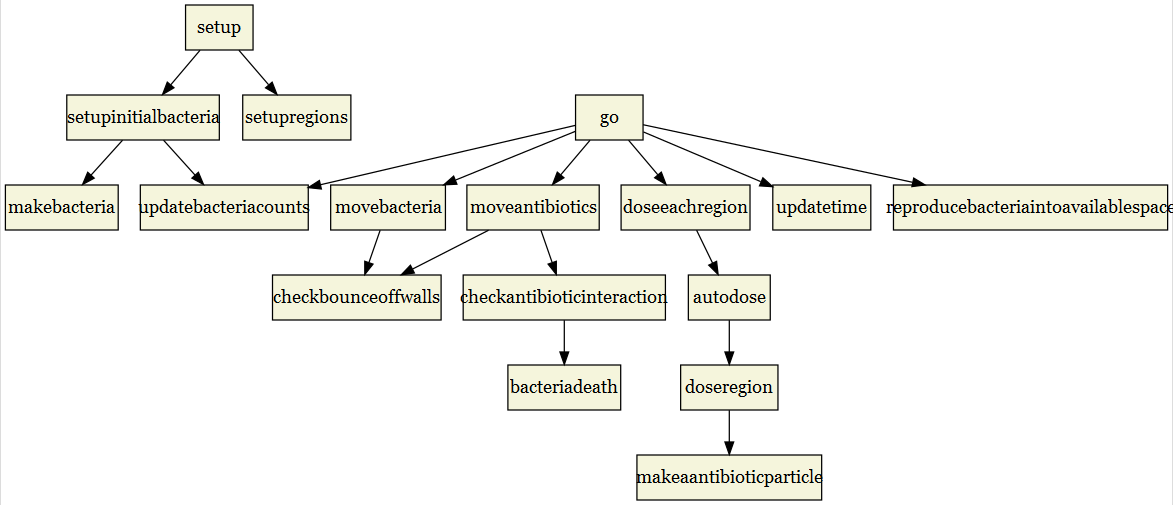
But we can always tweak it and make some improvements. How about adding some color, changing the font, and changing the ellipses to boxes?
diagram = paste(
  "
  digraph {
      graph [fontsize = 10, fontname = Helvetica]

      node [shape = box, fillcolor = Beige, style = filled]
  ",paste(nodes,collapse = '; '),"

  ",paste(map2_chr(edges$from,edges$to,function(x,y)paste0(c(x,y), collapse = '->')),collapse = ' '),"
      }"
)
grViz(diagram)
The last change we might want to make is to highlight certain nodes. Let’s make it simple and just highlight setup and go. These two nodes are the only procedures directly called by the user, so let’s make them stand out. Let’s also make the arrows straight.
diagram = paste(
  "
  digraph {
      graph [fontsize = 10, fontname = Helvetica, splines = ortho]

      node [shape = triangle, fillcolor = Honeydew, style = filled]
    go; setup

      node [shape = box, fillcolor = Beige, style = filled]
  ",paste(nodes[which(!nodes %in% c('go','setup'))],collapse = '; '),"

  ",paste(map2_chr(edges$from,edges$to,function(x,y)paste0(c(x,y), collapse = '->')),collapse = ' '),"
      }"
)
grViz(diagram)
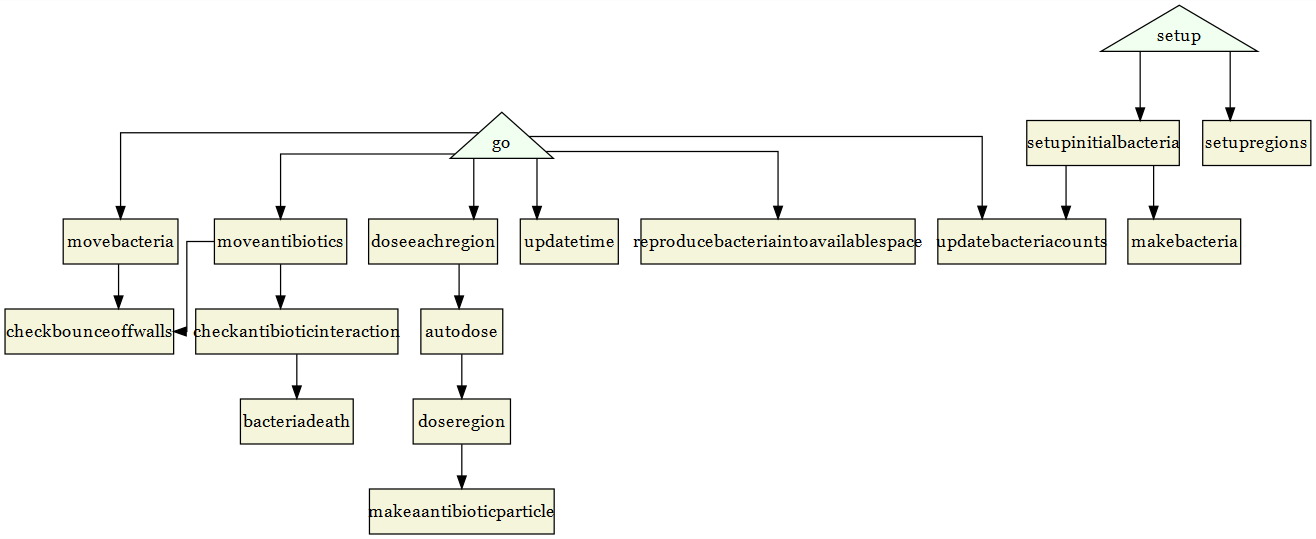
And that is a much improved flowchart from the initial igraph plot and this code is easily adaptable to any NetLogo model. There are a lot of options that you can use to customize the flowchart even further, but we still need to save the flowchart. We can use the DiagrammeRsvg for that and save to file or save as a png using the magick package as well.
library(DiagrammeRsvg, quietly = T, warn.conflicts = F)
grViz(diagram) %>% export_svg() %>% writeLines(con = "flowChart.svg")
library(magick, quietly = T, warn.conflicts = F)
grViz(diagram) %>% export_svg() %>% image_read_svg() %>% image_write("flowChart.png")
And there you have an automatically generated flowchart, and for most NetLogo models all you would have to do is change the file name and path.